Santa Barbara Area Real Estate Market Update January 2019
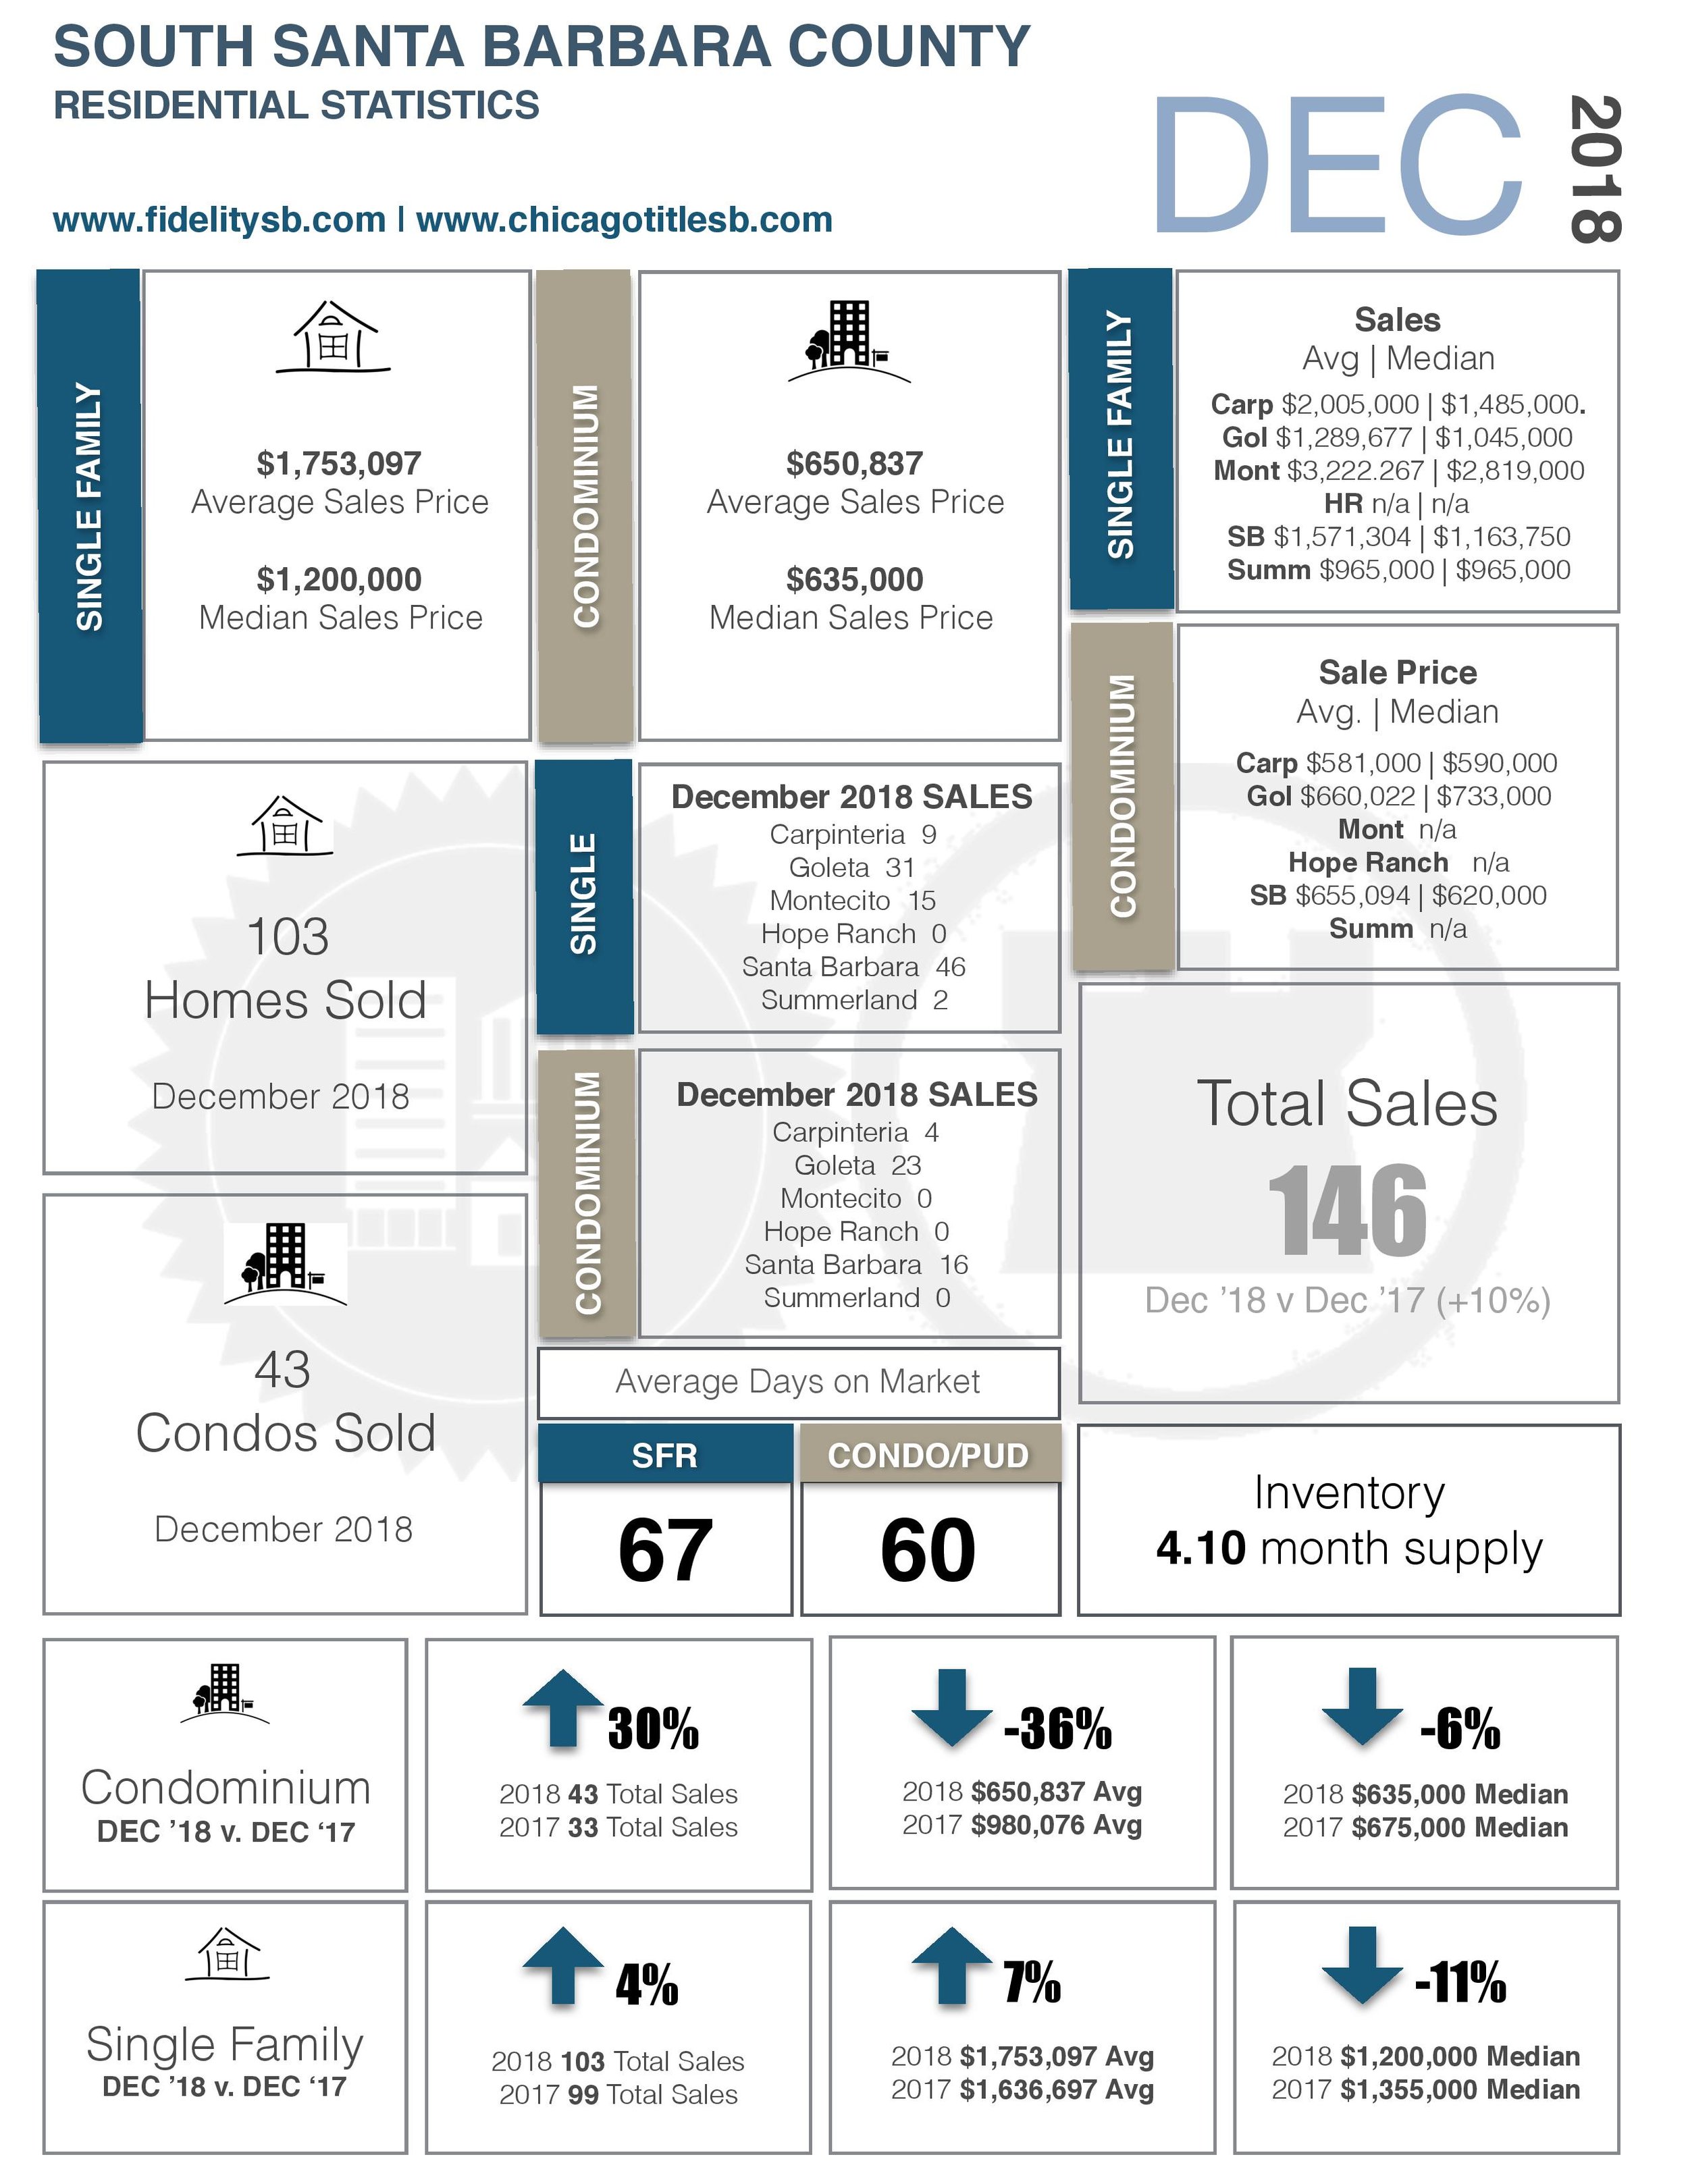
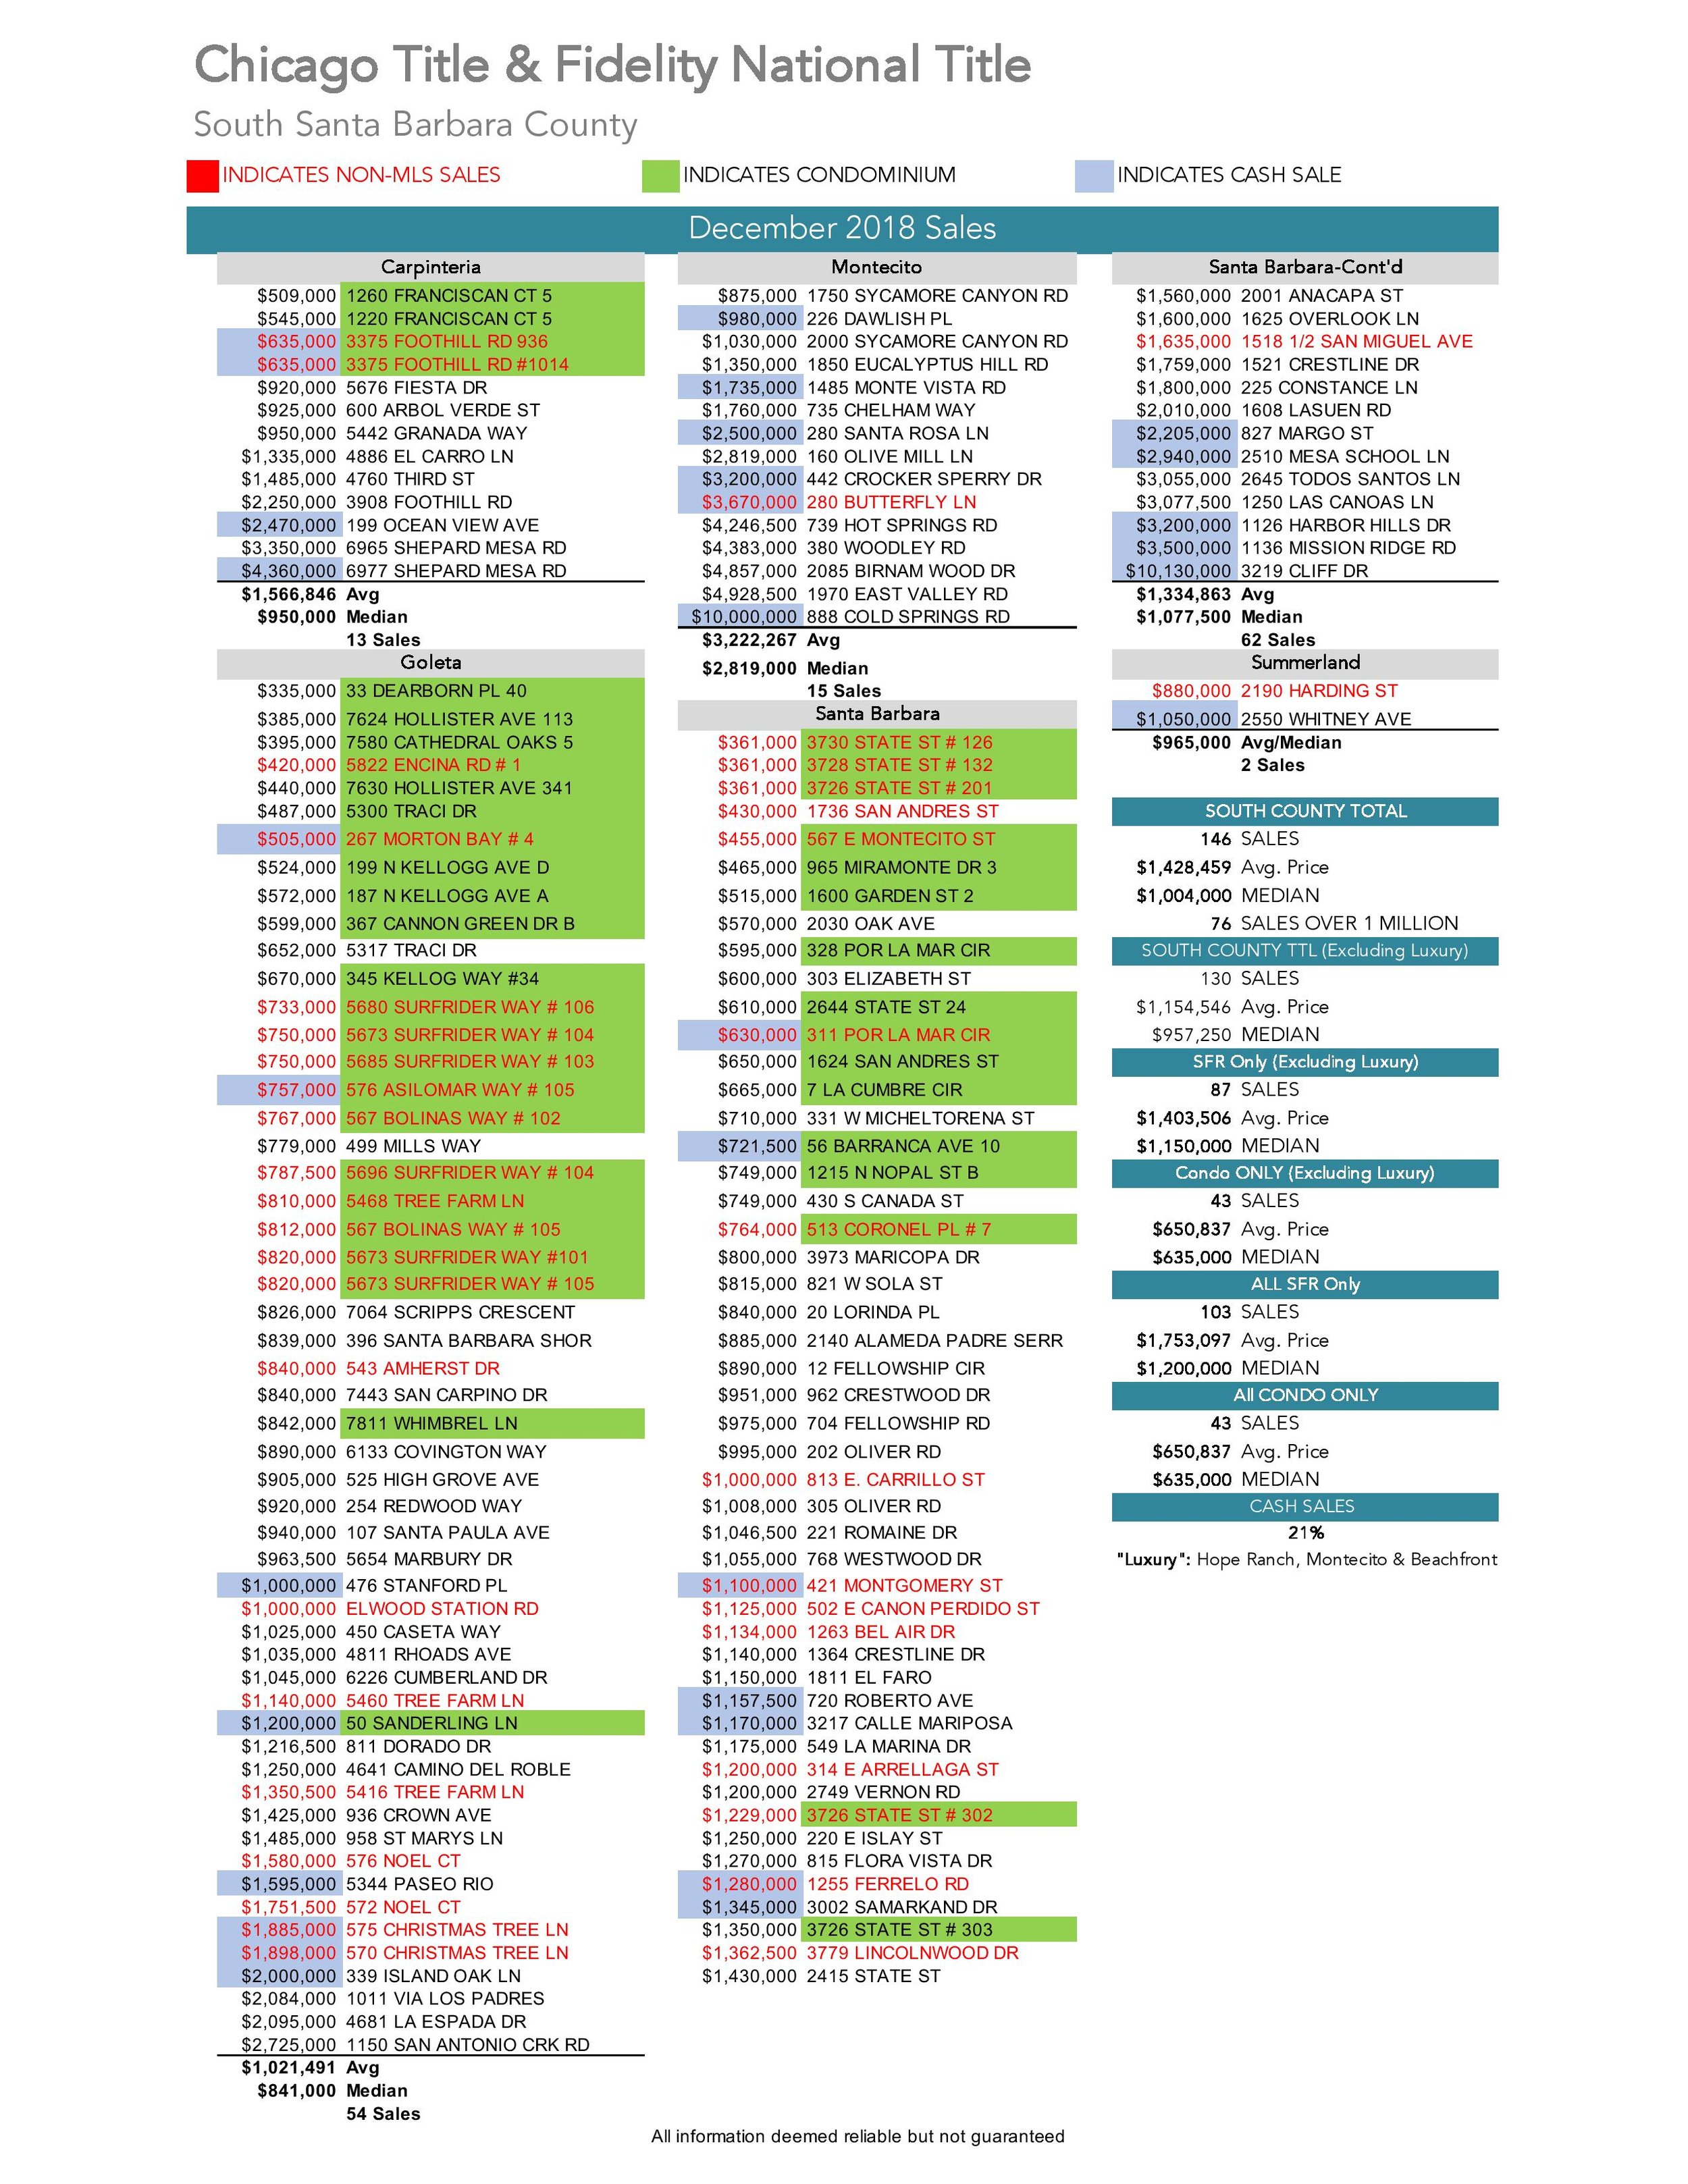
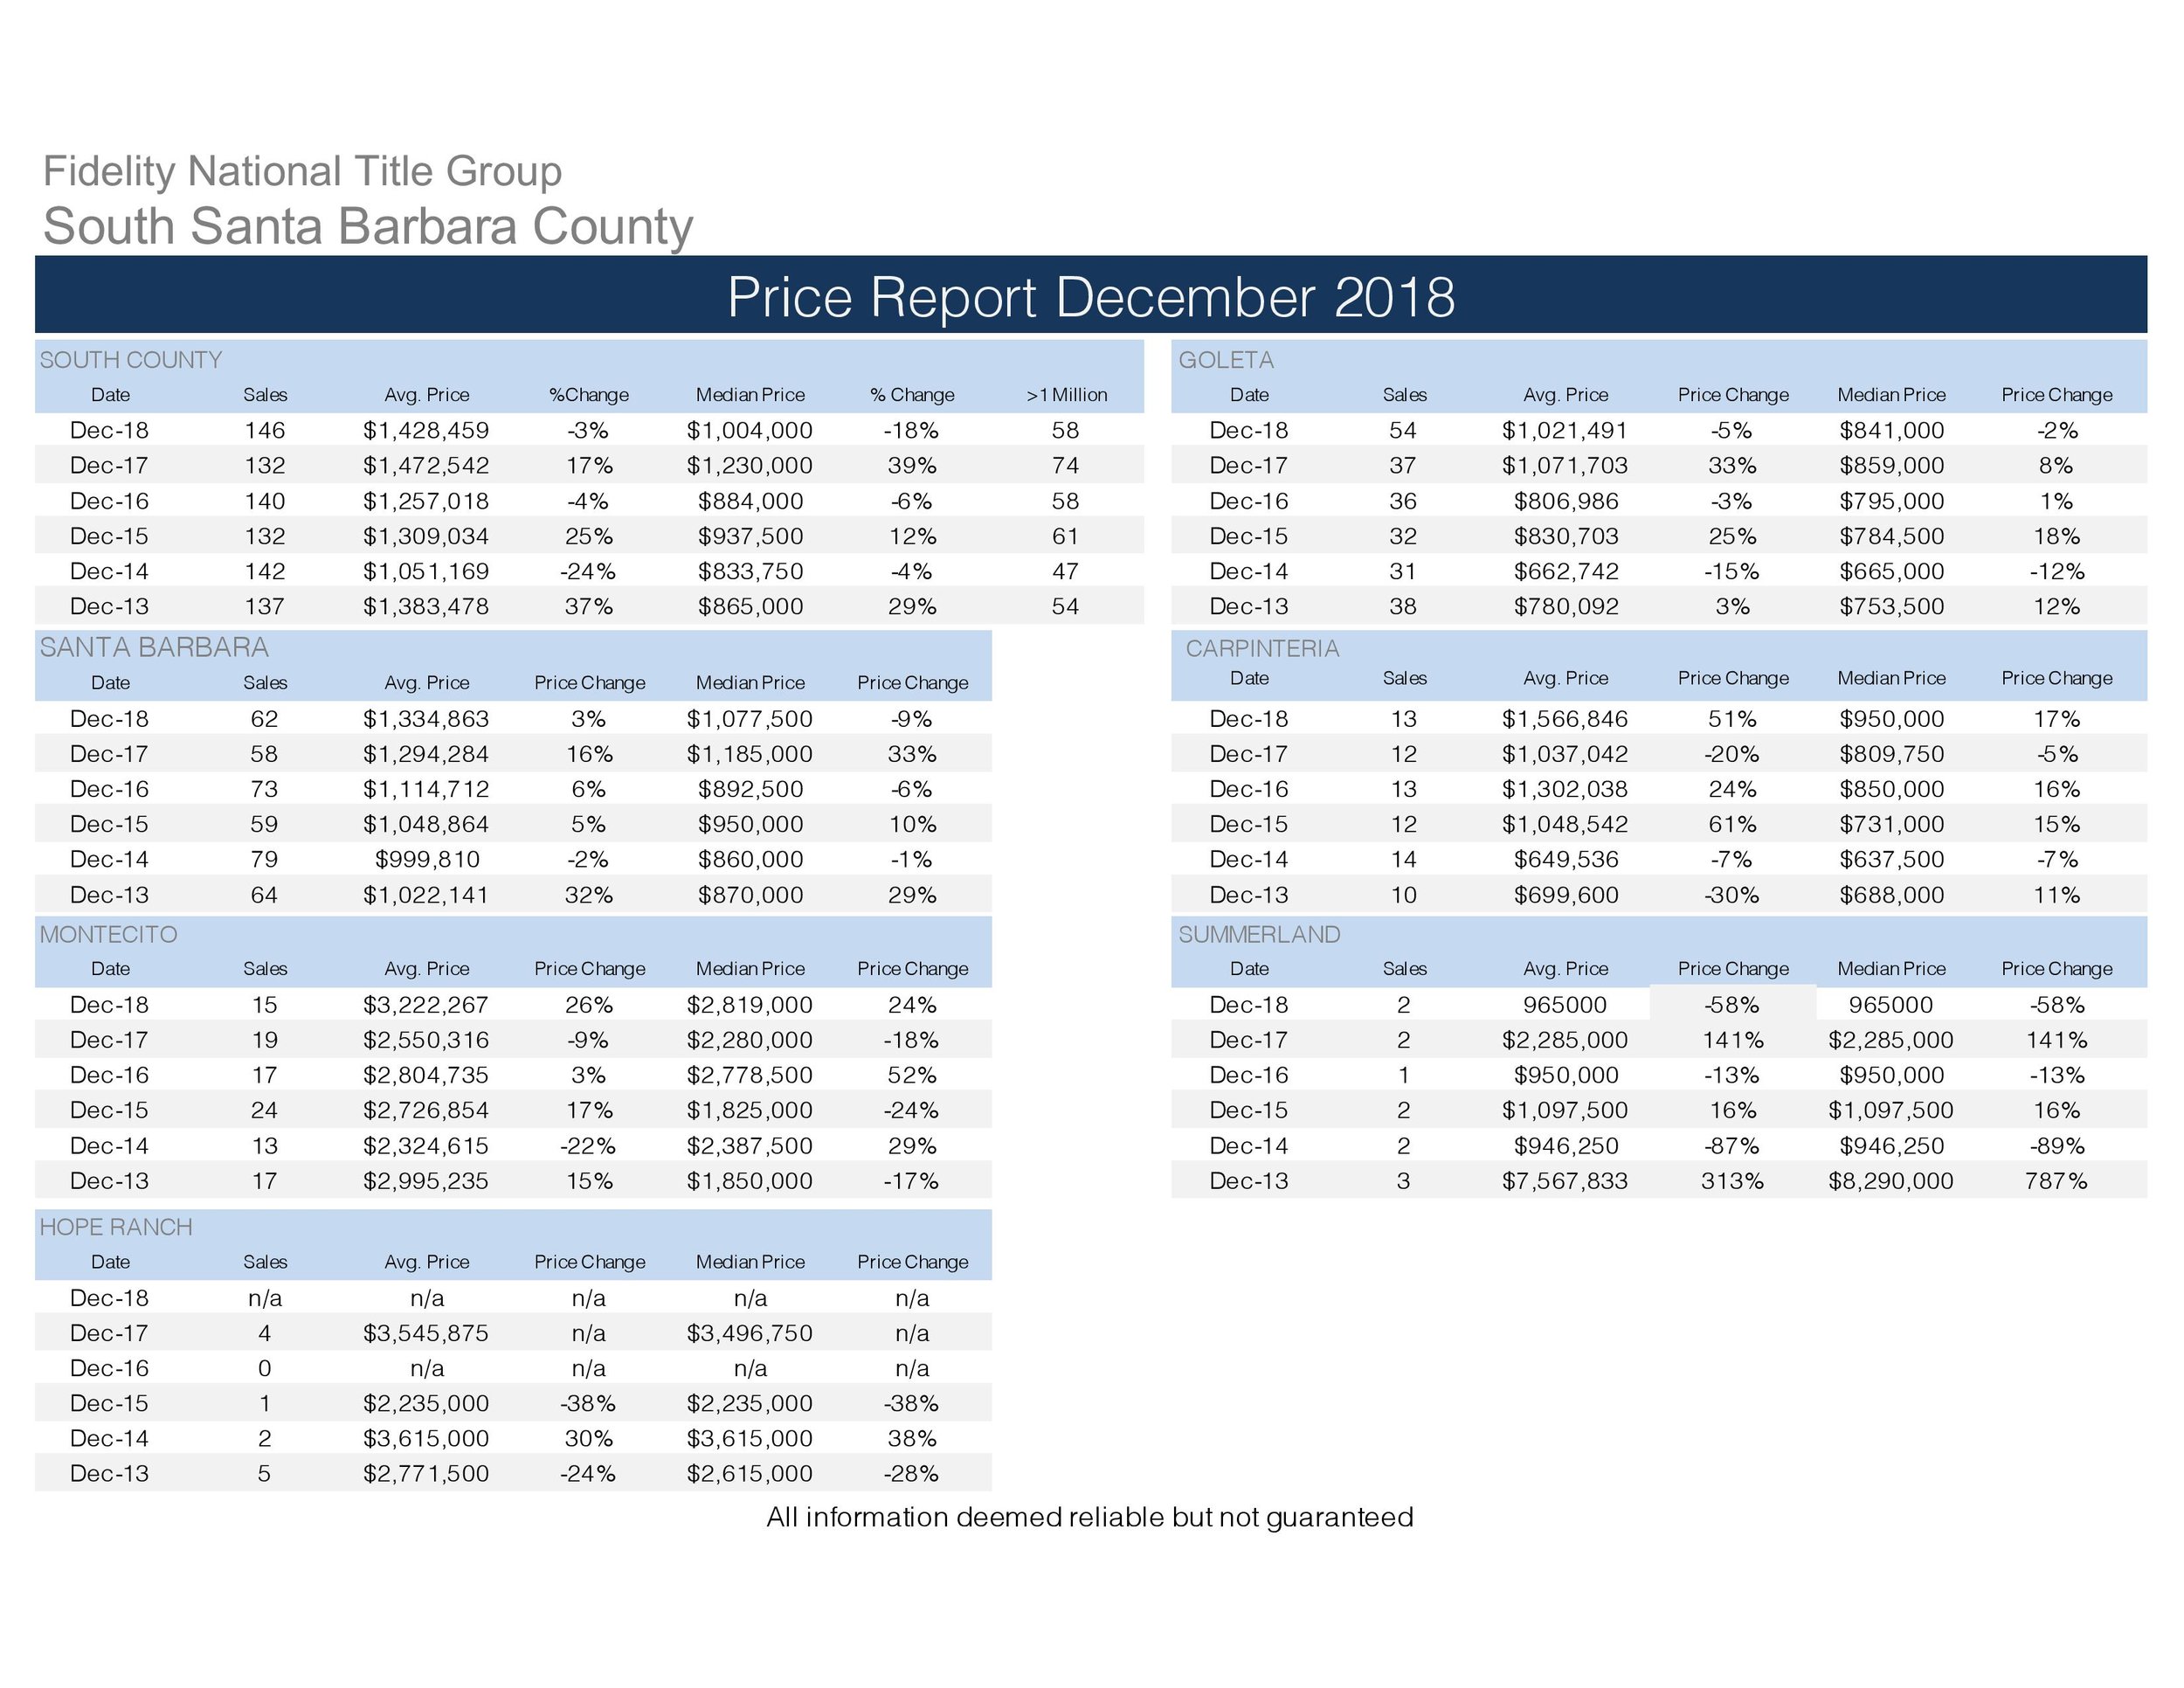
A big thanks to Fidelity National Title for putting together these reports! I like using these because Fidelity tracks all sales, not just sales in the Santa Barbara Multiple Listing Service (MLS). Last month, December 2018, we had 39 Non-MLS sales out of a total of 146 sales. Note that 19 of these sales are new construction sales in Goleta and Santa Barbara being reported by the builder that didn't hit MLS . . . Taking these out of the equation, puts us around 14% of December 2018 sales were outside the traditional MLS.
So what's the latest with cash buyers in the Santa Barbara Area Real Estate Market? Out of the 146 sales in November, 21% were all cash. Seems we’ve been averaging about 20% of our monthly sales are ALL CASH, so this is par for the course, and what we would expect to see. We are seeing cash sales at all price points in the market - the low and high end.
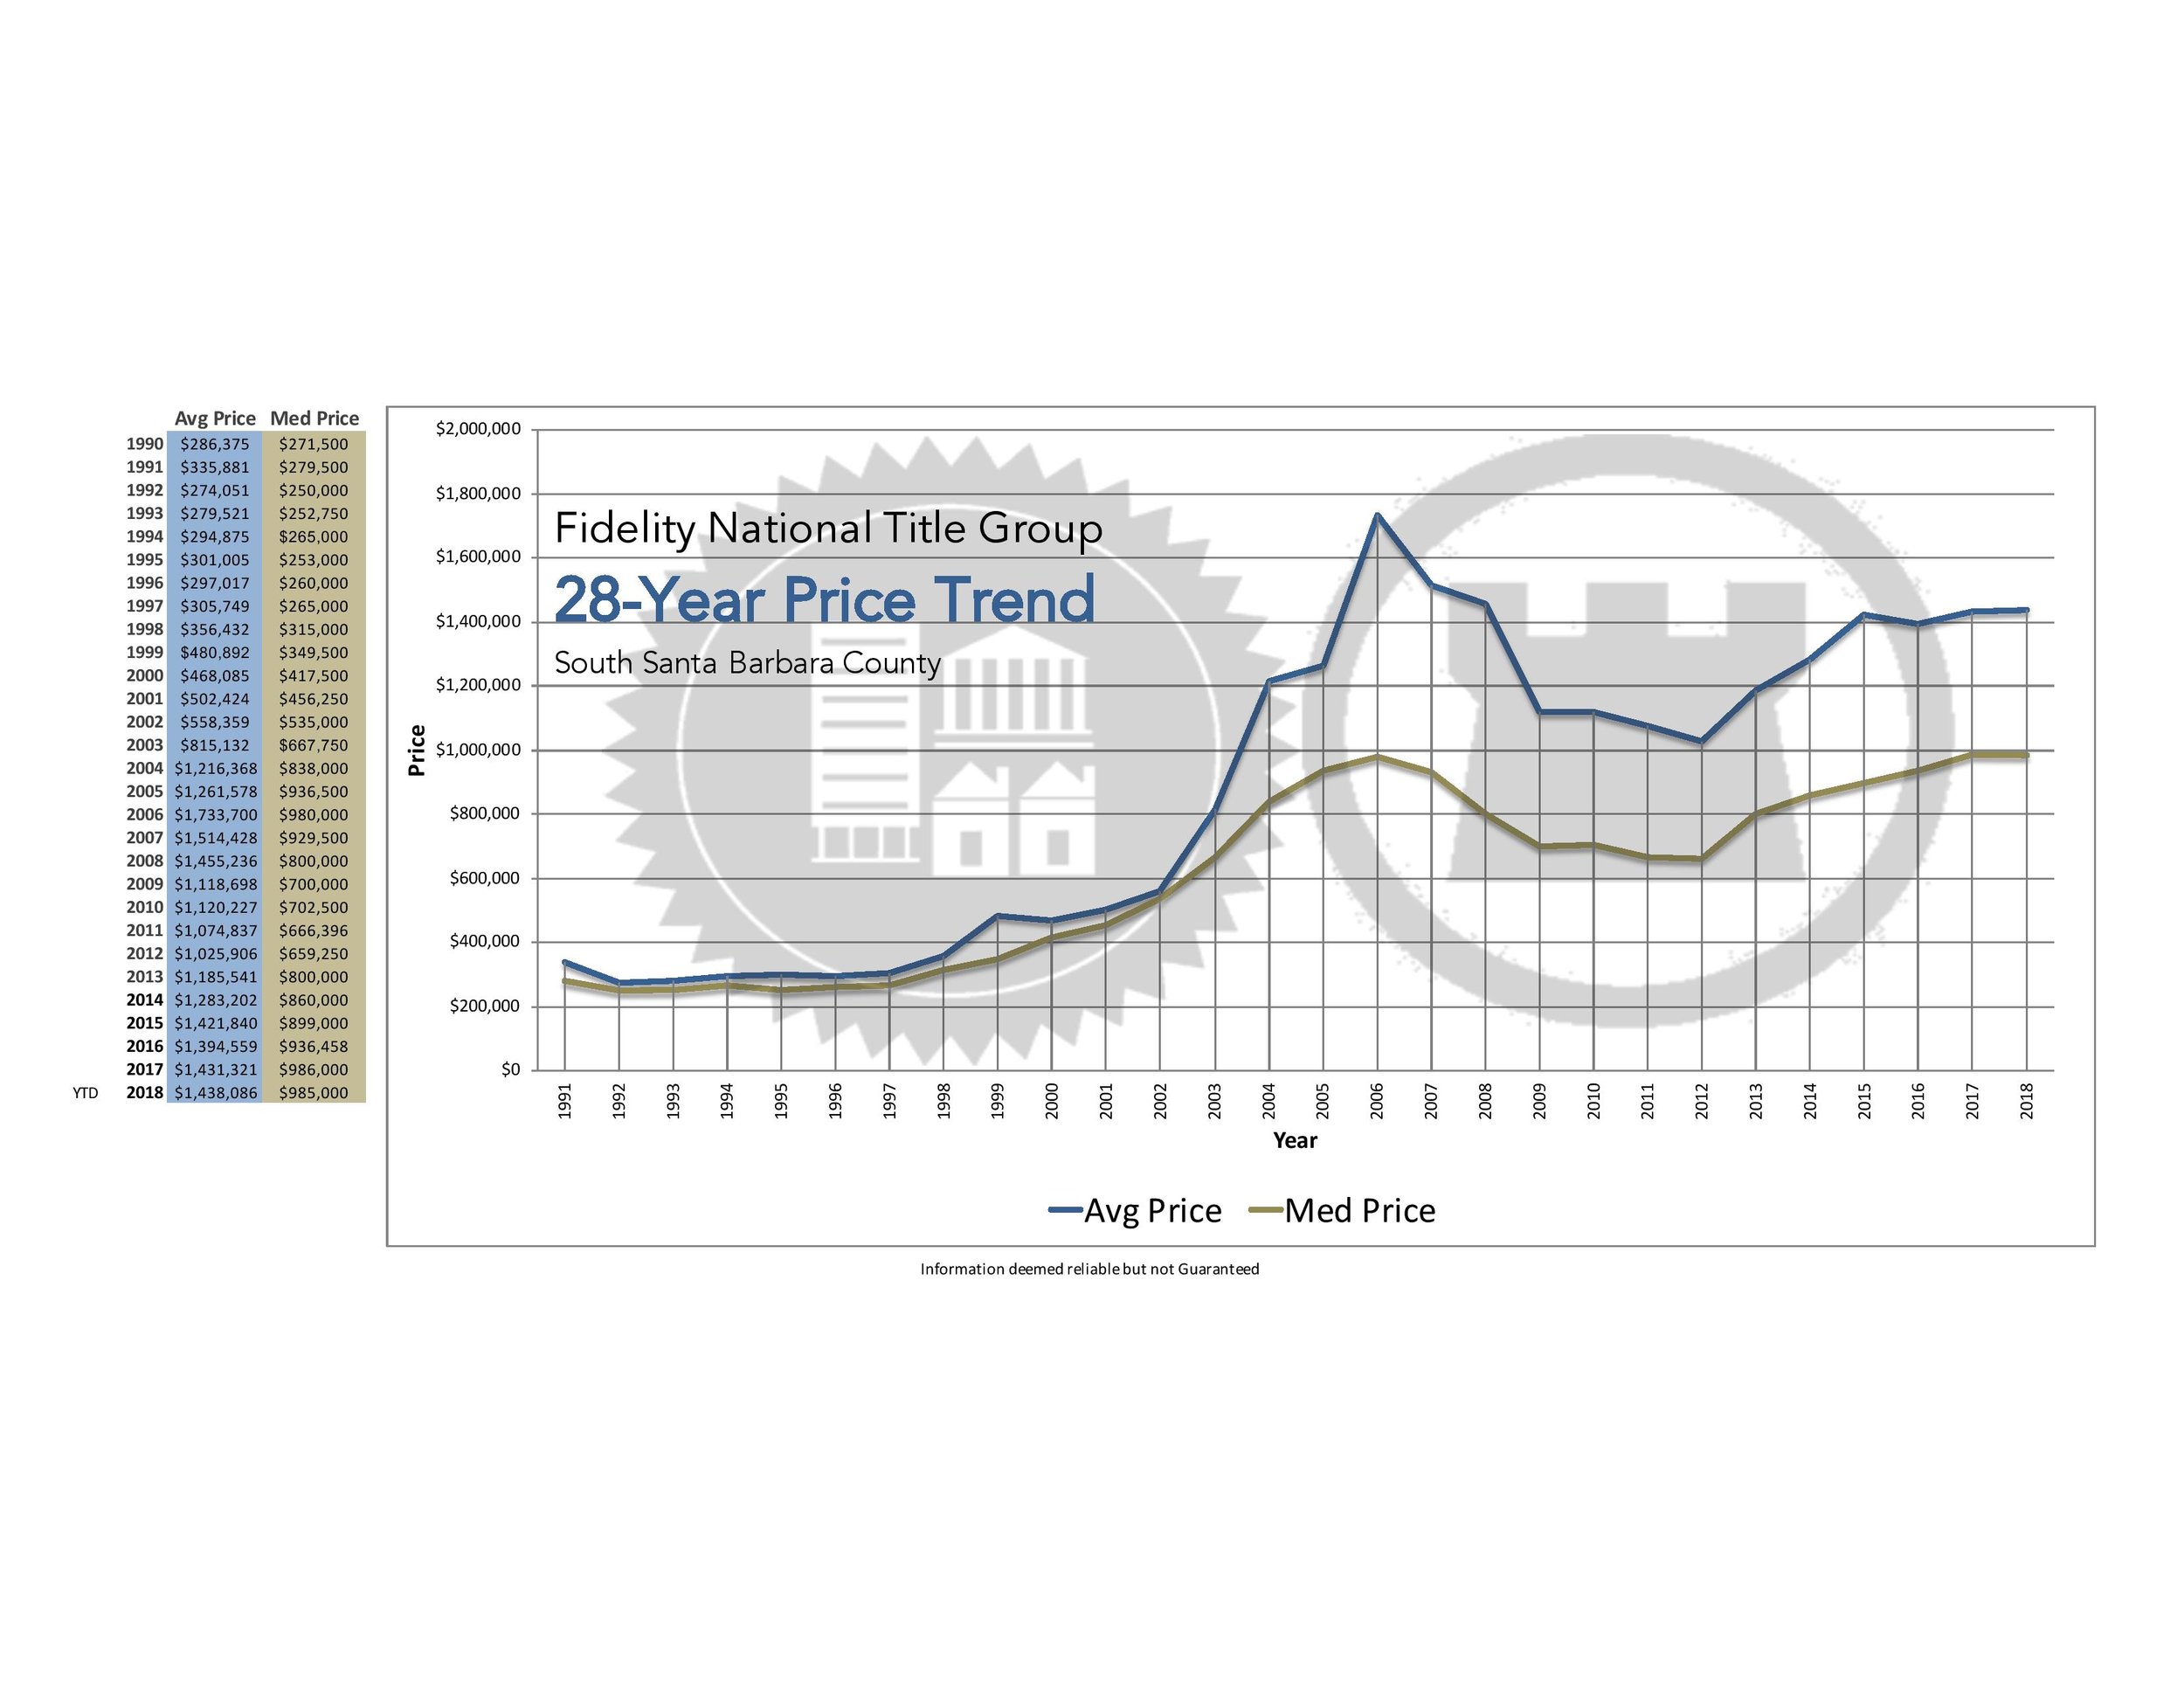
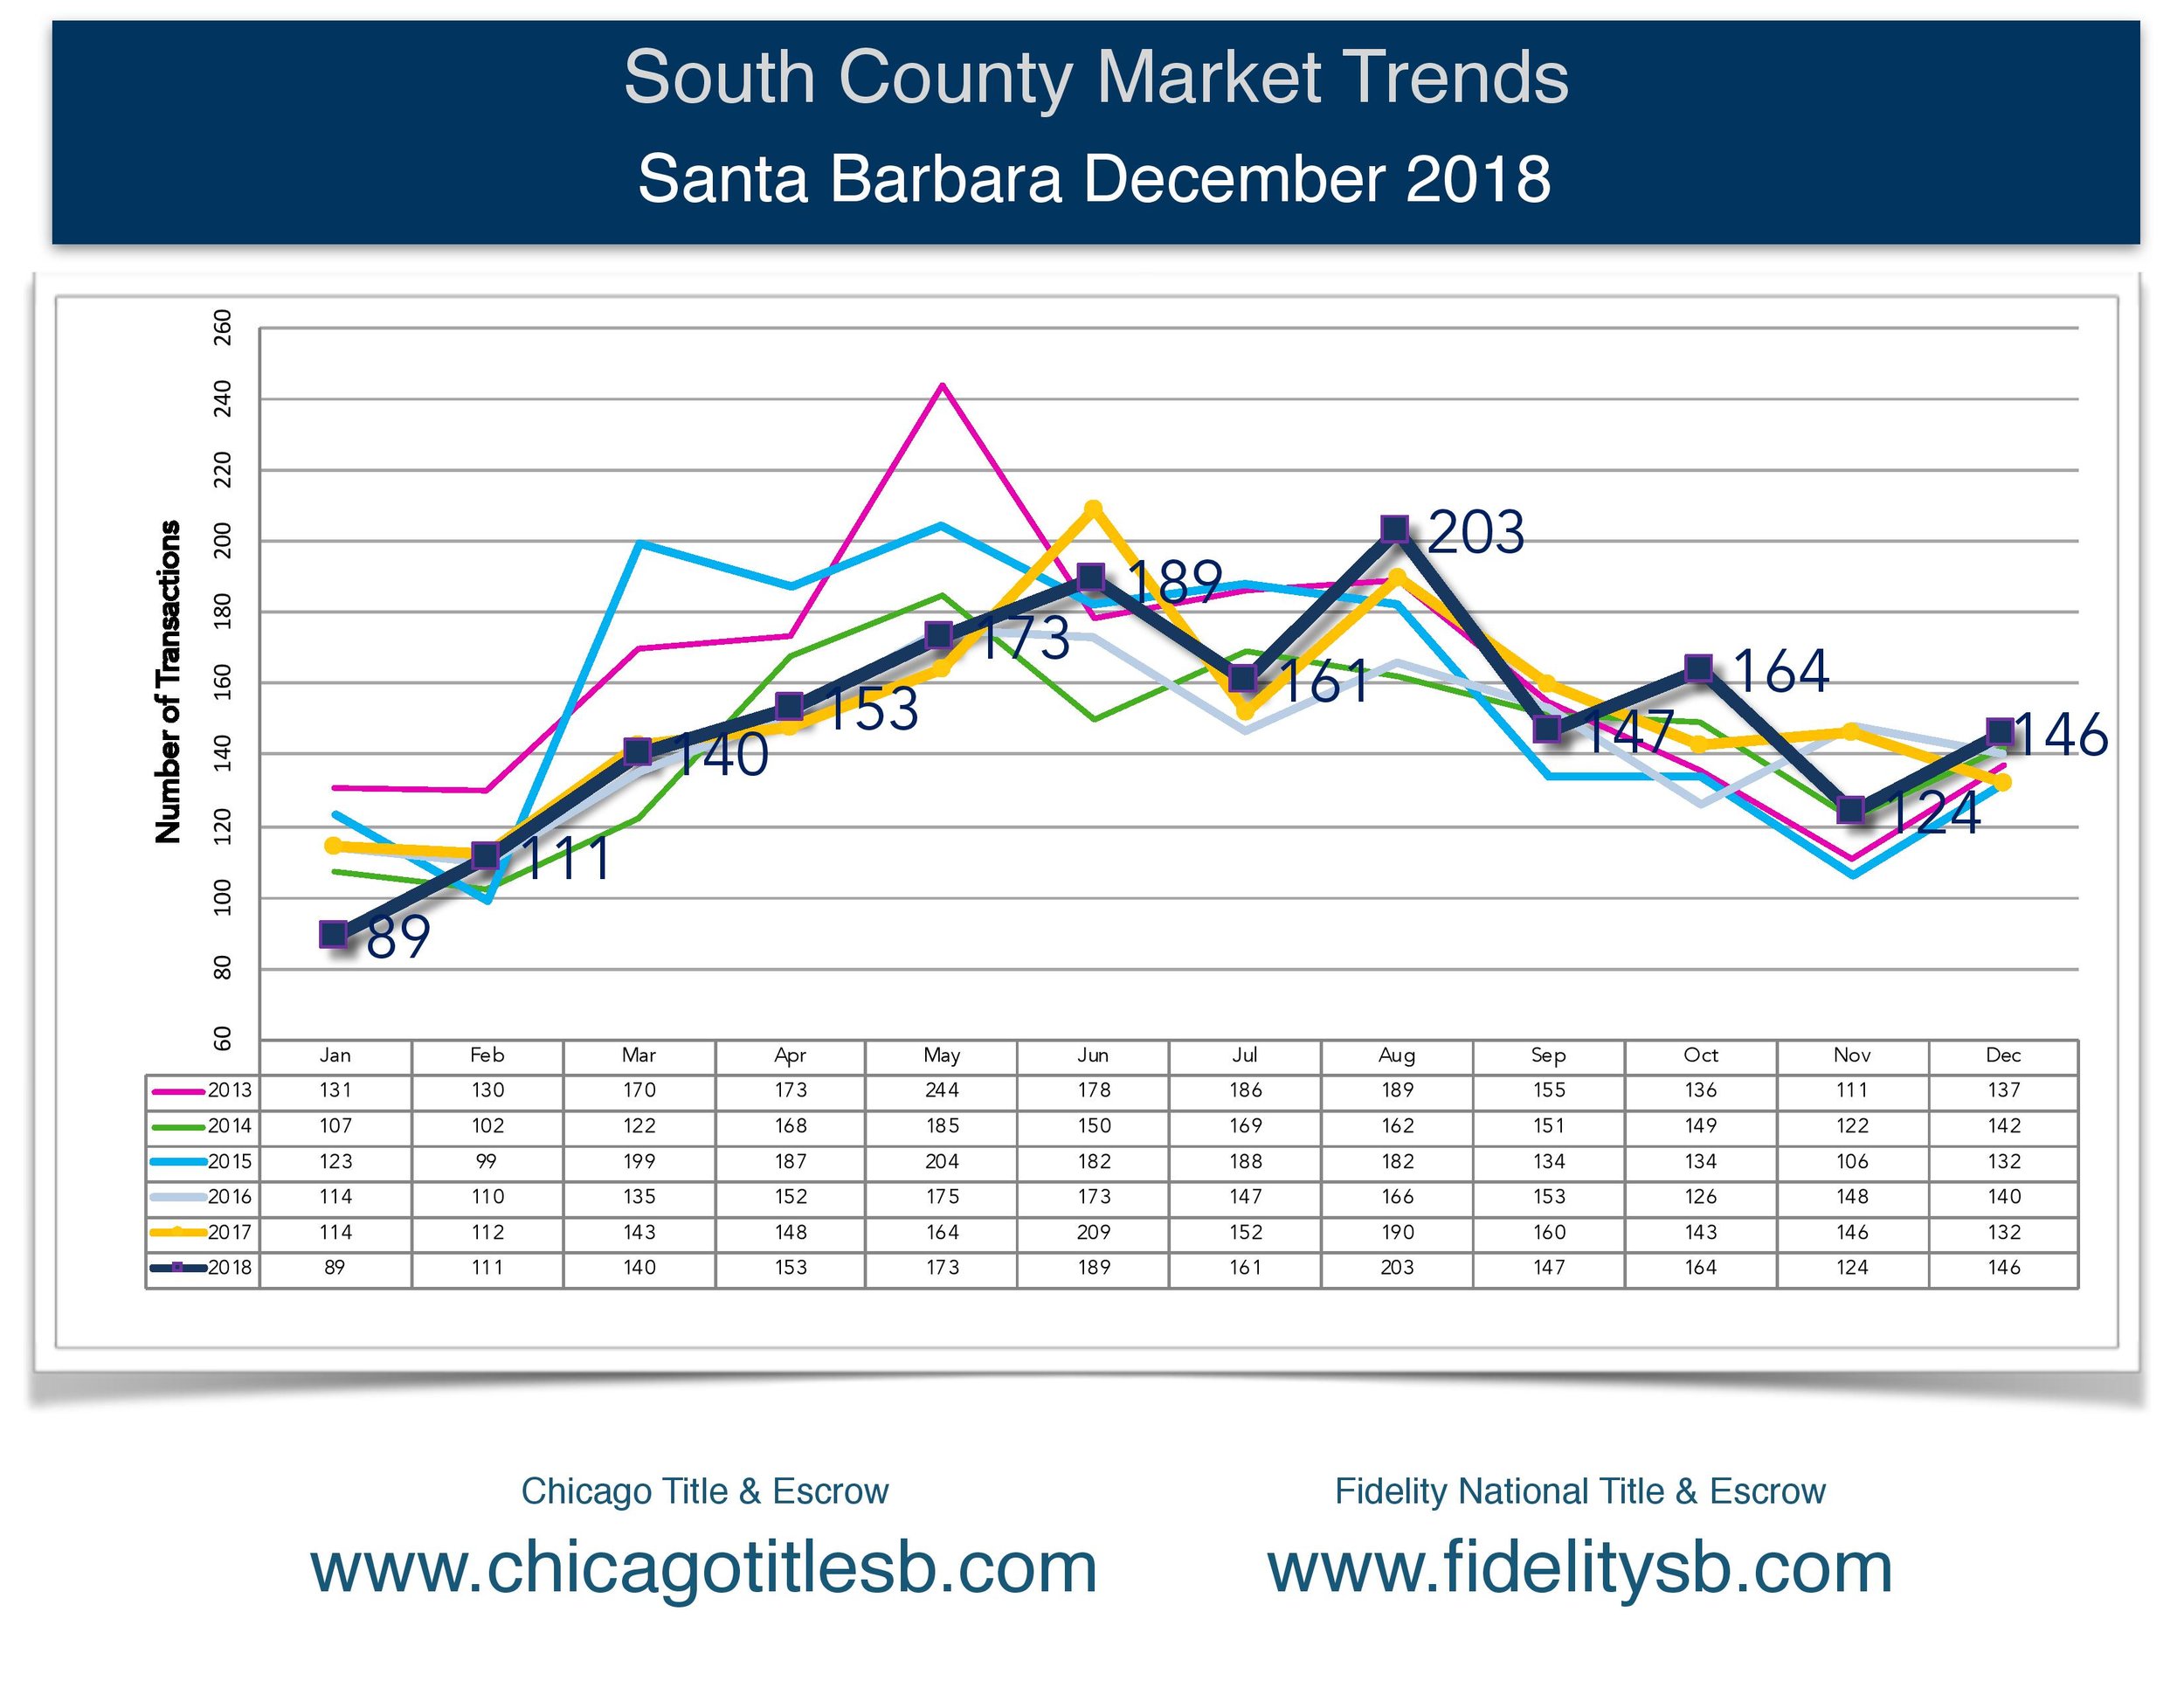
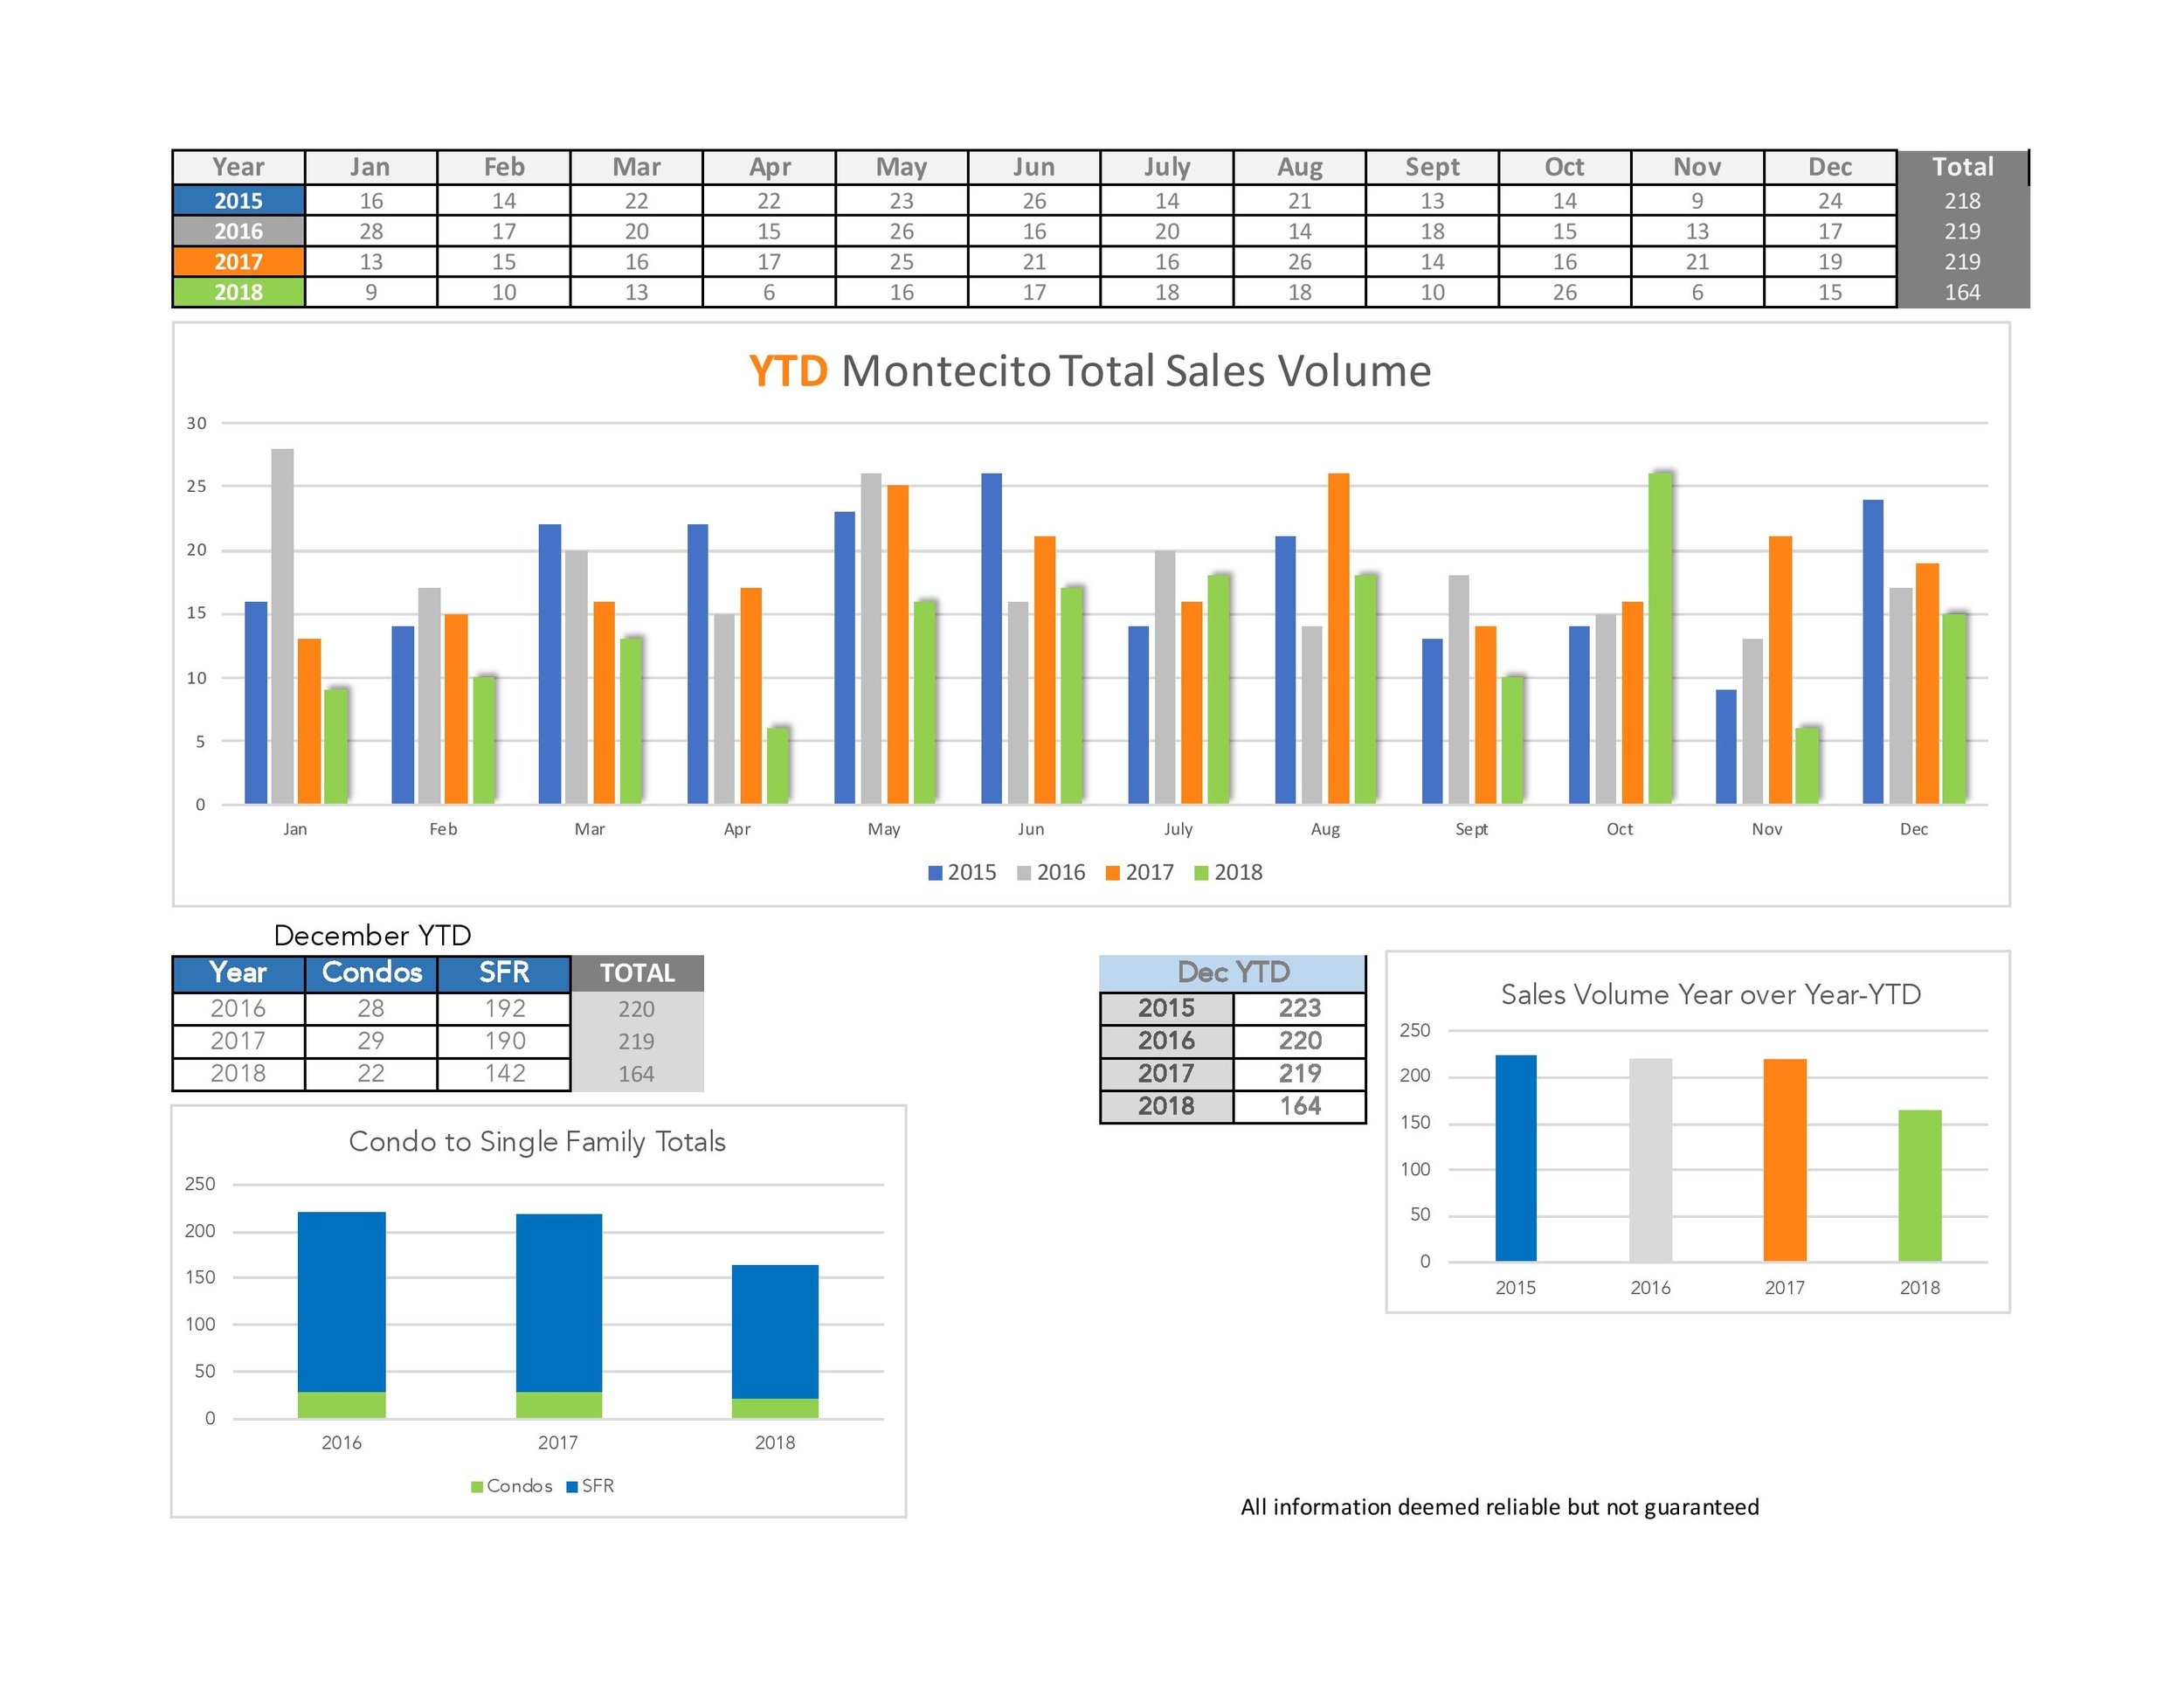
Our 2018 median sales price for single family homes (January - December) comes in at $1,200,000, which is 2% less than 2017 ($1,225,000). Additionally, we see our total sales for 2018 are off about 7% compared to 2017. Our 2018 condo sales numbers are up 14% from 2017, and median price is up 7%. This can be attributed to the handful of new construction condo projects now being sold in Goleta and Santa Barbara.
As far as month’s supply of inventory, we are seeing this skew to a more balanced market. Currently we are seeing approximately 4.1 months of inventory for homes and condos. These numbers are trending toward a more balanced, buyer’s market. Generally speaking, less than 3 months of inventory is considered a seller’s market, 3-6 months a balanced market, and 6-9 months a buyer’s market.
What does 2019 hold for the Santa Barbara housing market? Rate increases will likely contribute to a flattening of our median sales prices, as rates are now at the highest level since 2011, but still considered historically low by comparison. We will also see more inventory coming this Spring, as seller’s may want to realize gains as prices plateau or slightly decline. Buyer’s will have more to choose from, and home prices will need to be competitive to attract buyers. All in all, we are in a healthier market that is responding to market forces.
Check out the graphs and charts below for more information.
As always, please Contact Me with any questions or feedback!
Click on Images for pdf versions