Santa Barbara Area Real Estate Statistics October 2018
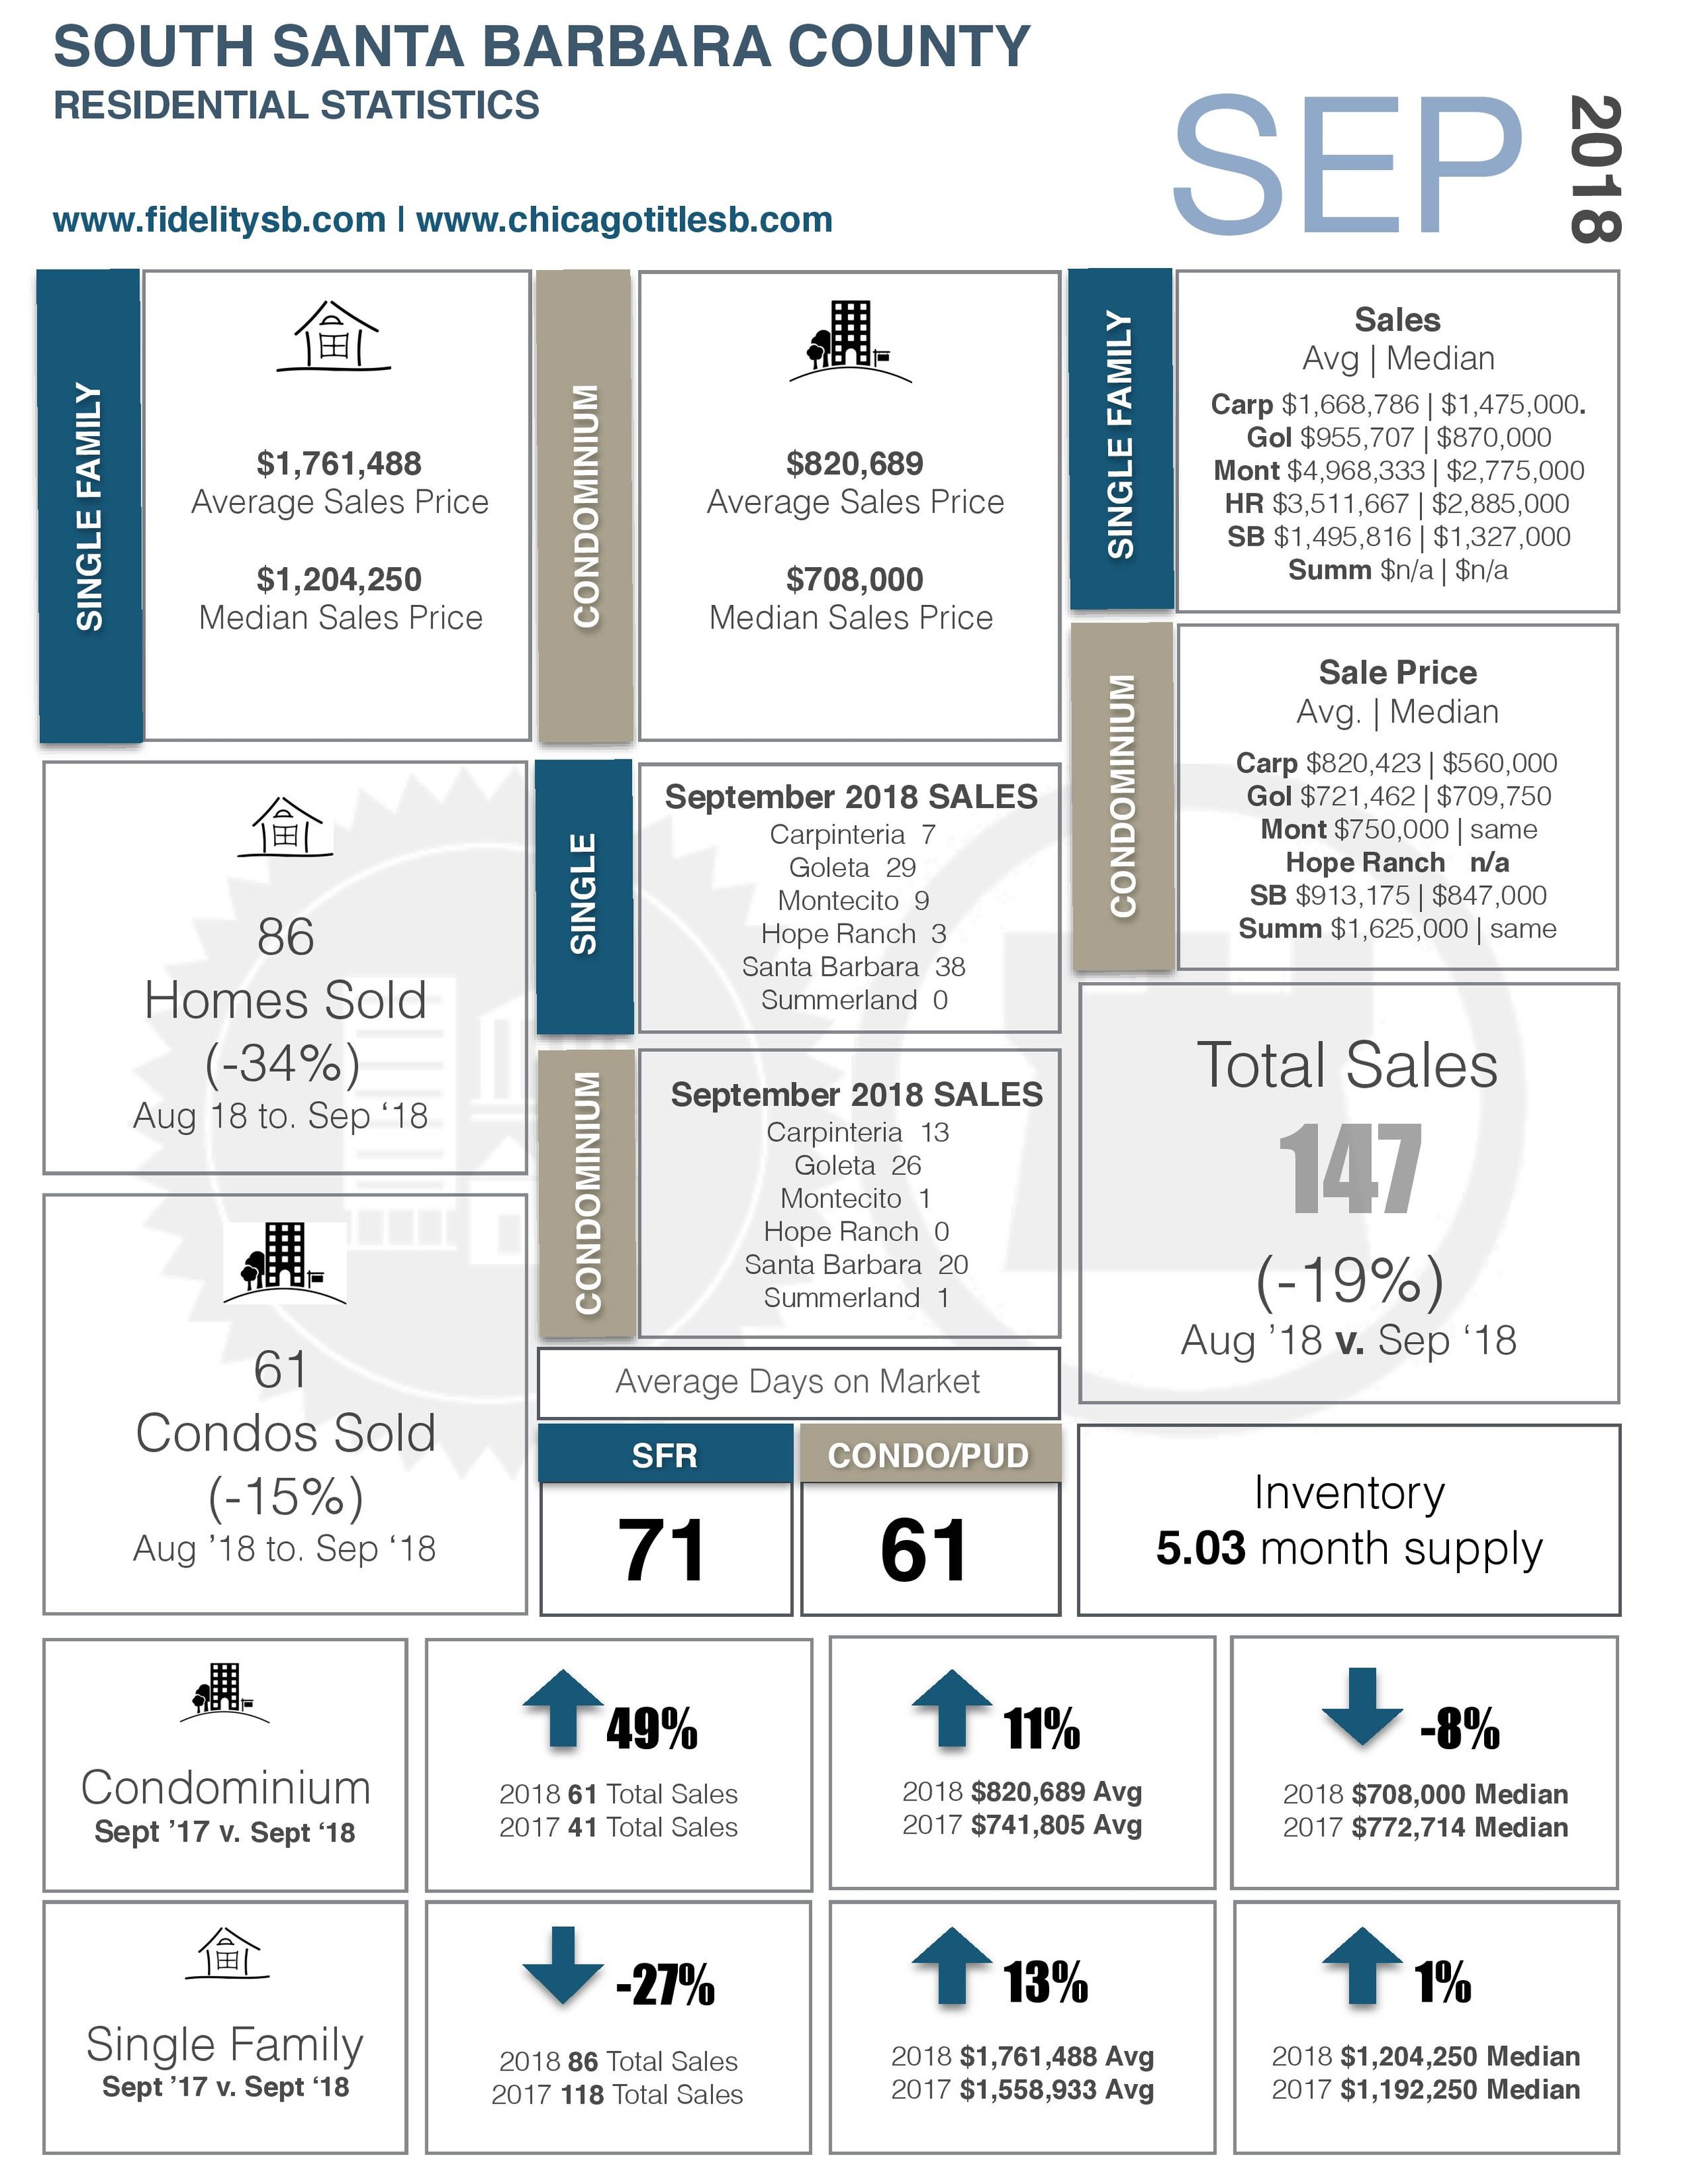
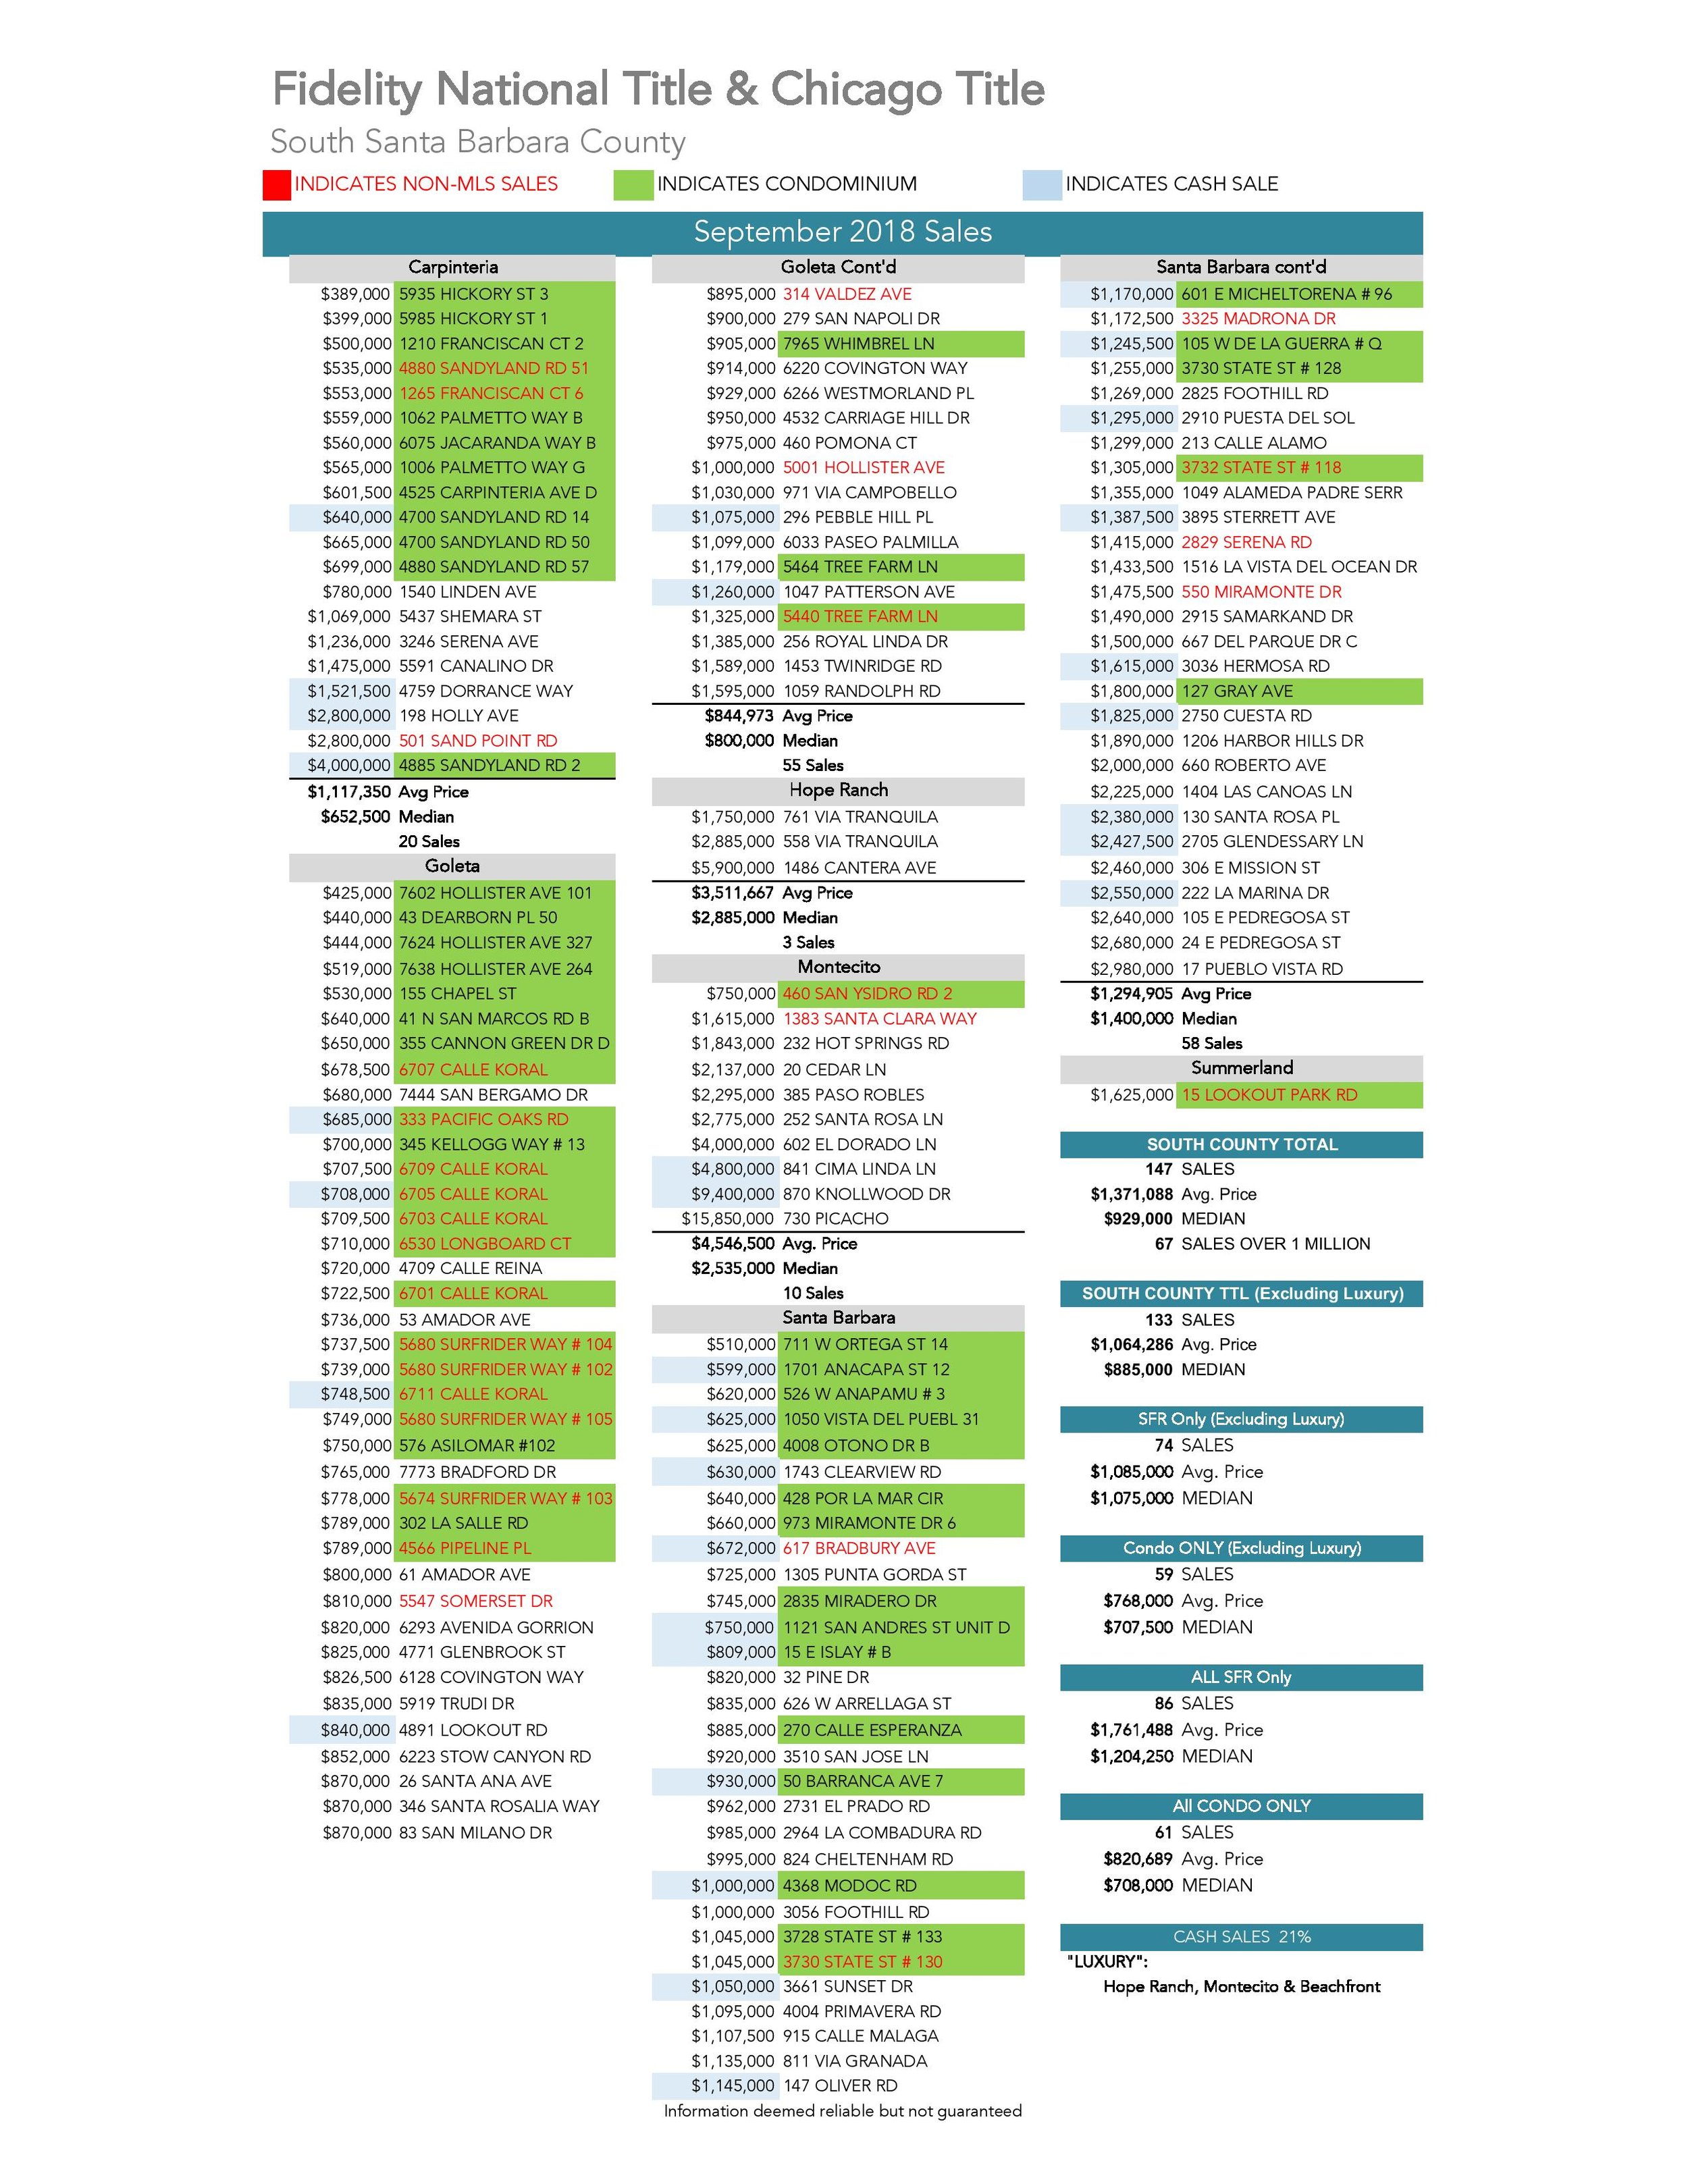
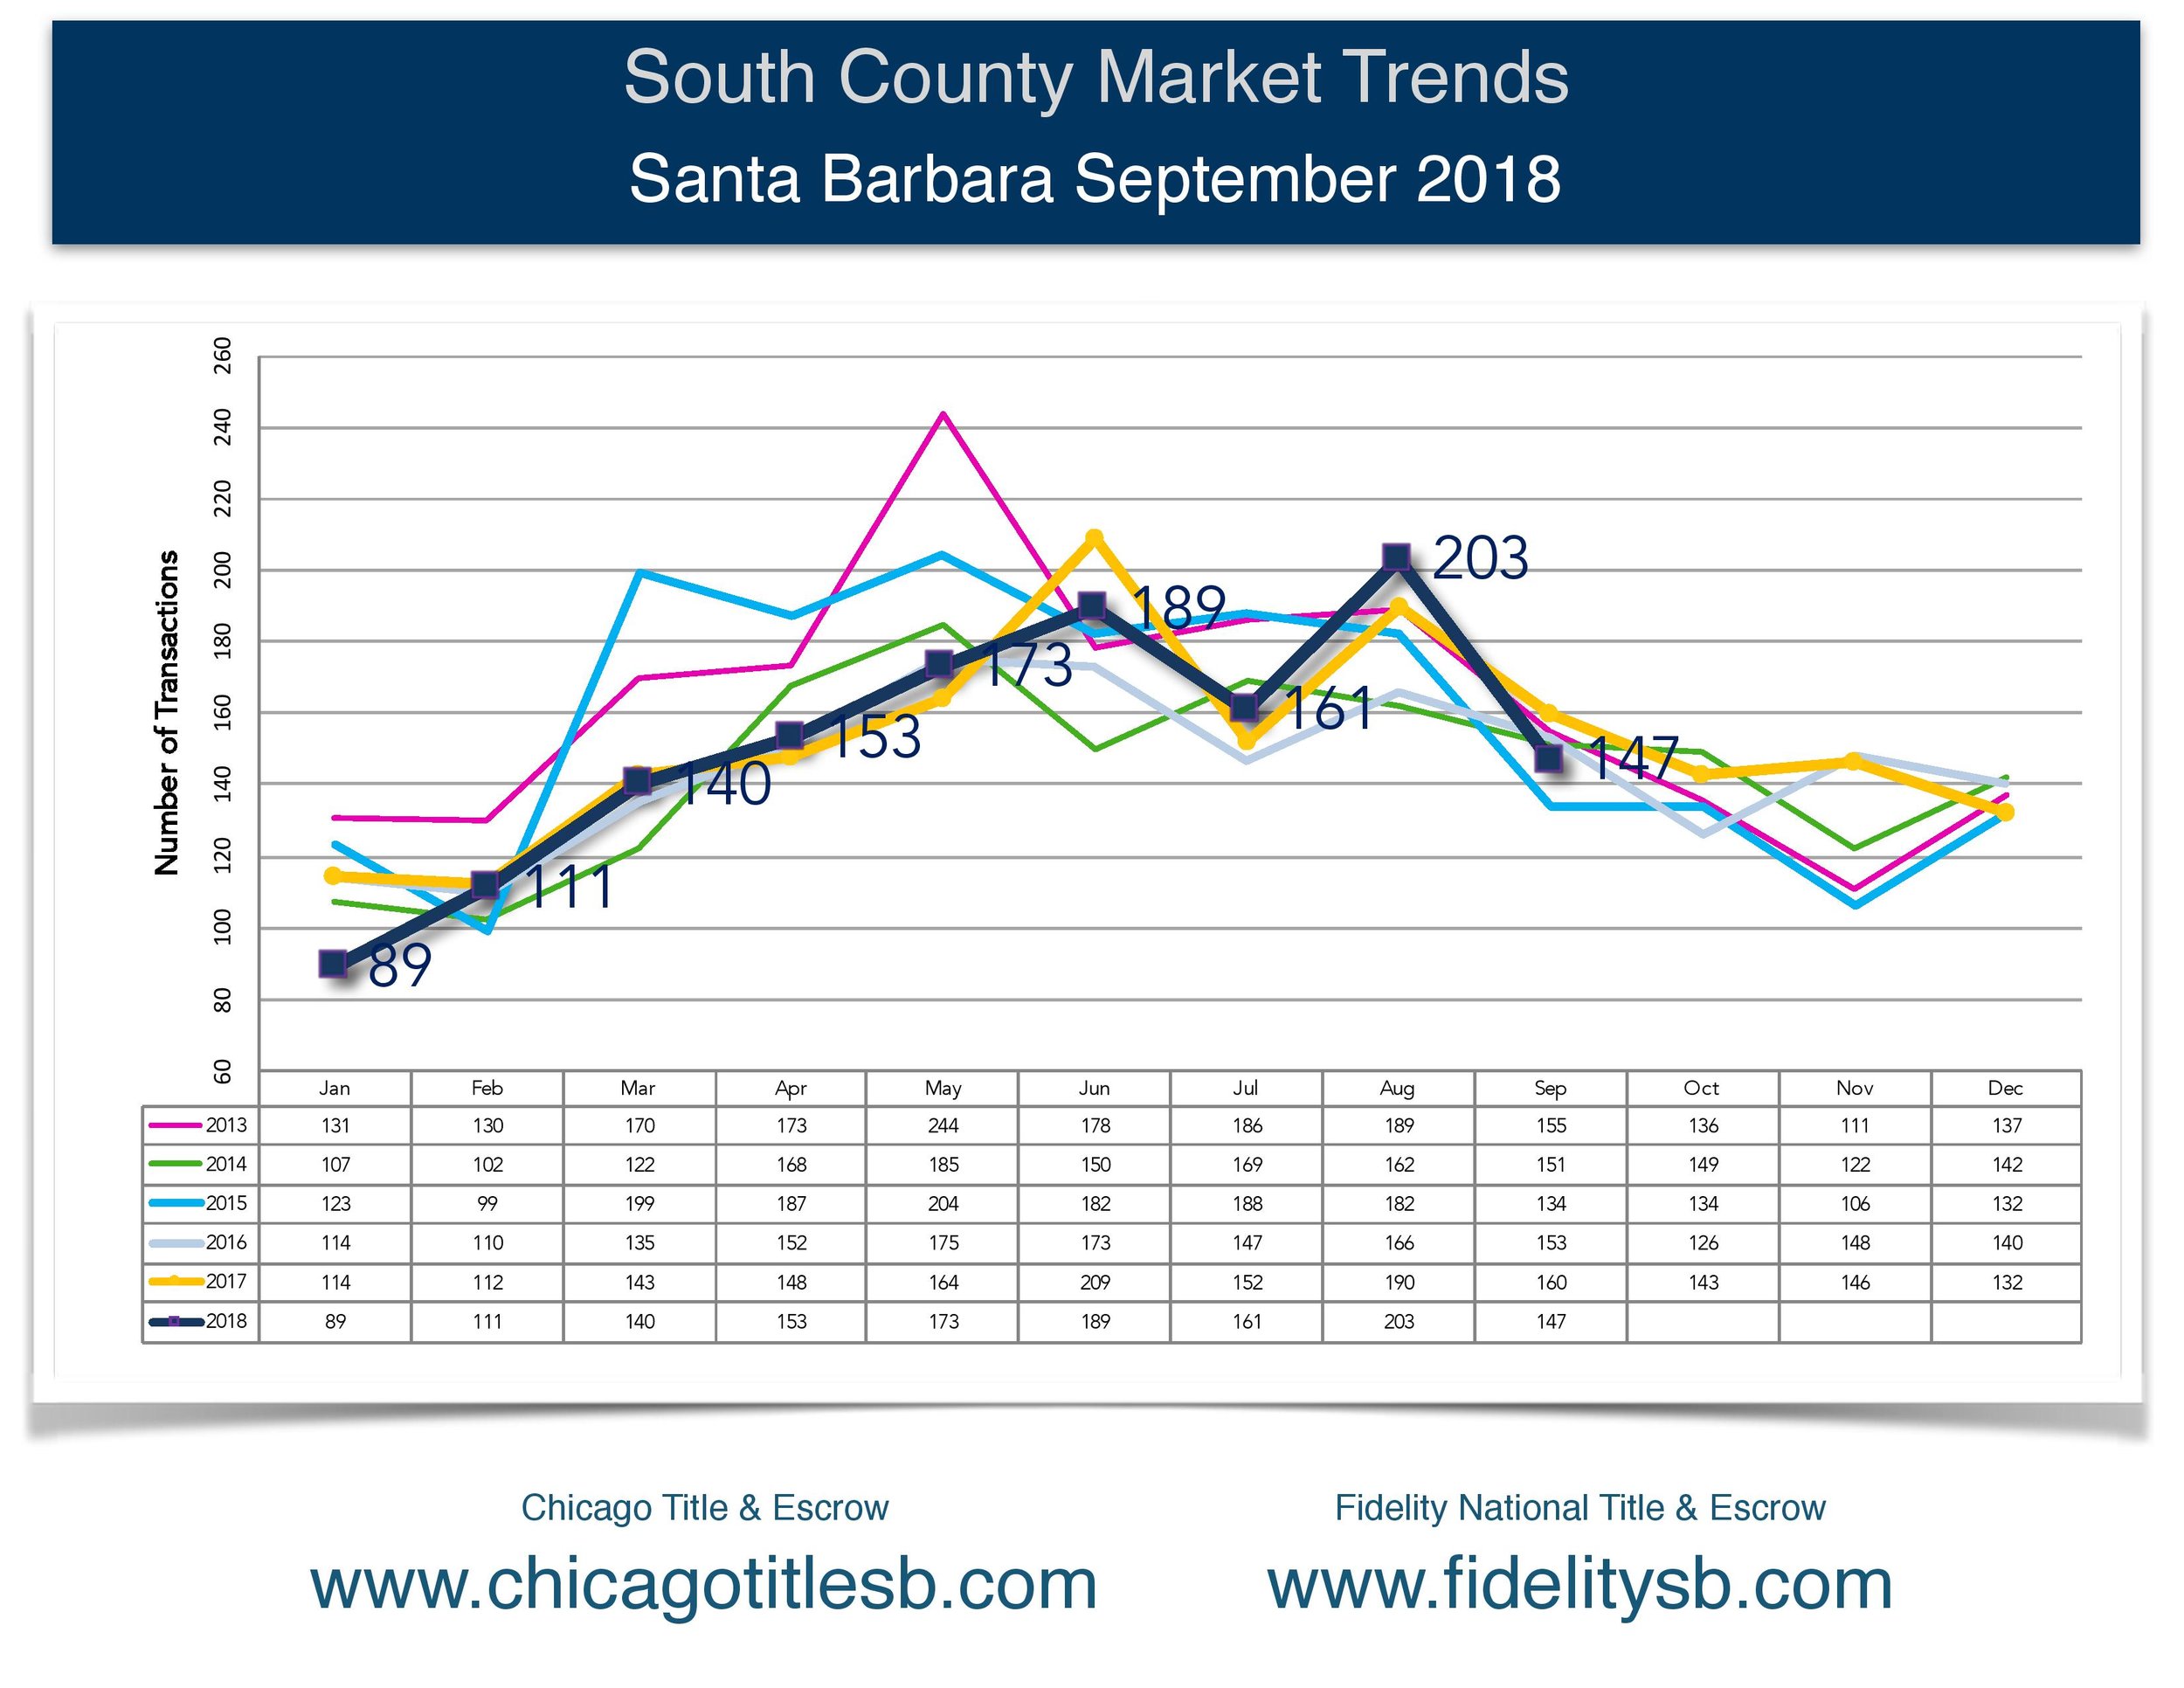
Another big thanks to Fidelity National Title for putting together these reports! I like using these because Fidelity tracks all sales, not just sales in the Santa Barbara Multiple Listing Service (MLS). Last month, September 2018, we had 29 Non-MLS sales out of a total of 147 sales. Note that 14 of these sales are new construction sales being reported by the builder that didn't hit MLS . . . Taking these out of the equation, puts us around 10% of September 2018 sales are outside the traditional MLS.
So what's the latest with cash buyers in the Santa Barbara Area Real Estate Market? Out of the 147 sales in September, 31 were all cash - that’s 21%! In August that figure was 24%, with 48 cash sales out of 203! Bottom line, we are seeing lots of cash at all price points in the market - it’s not just the high end.
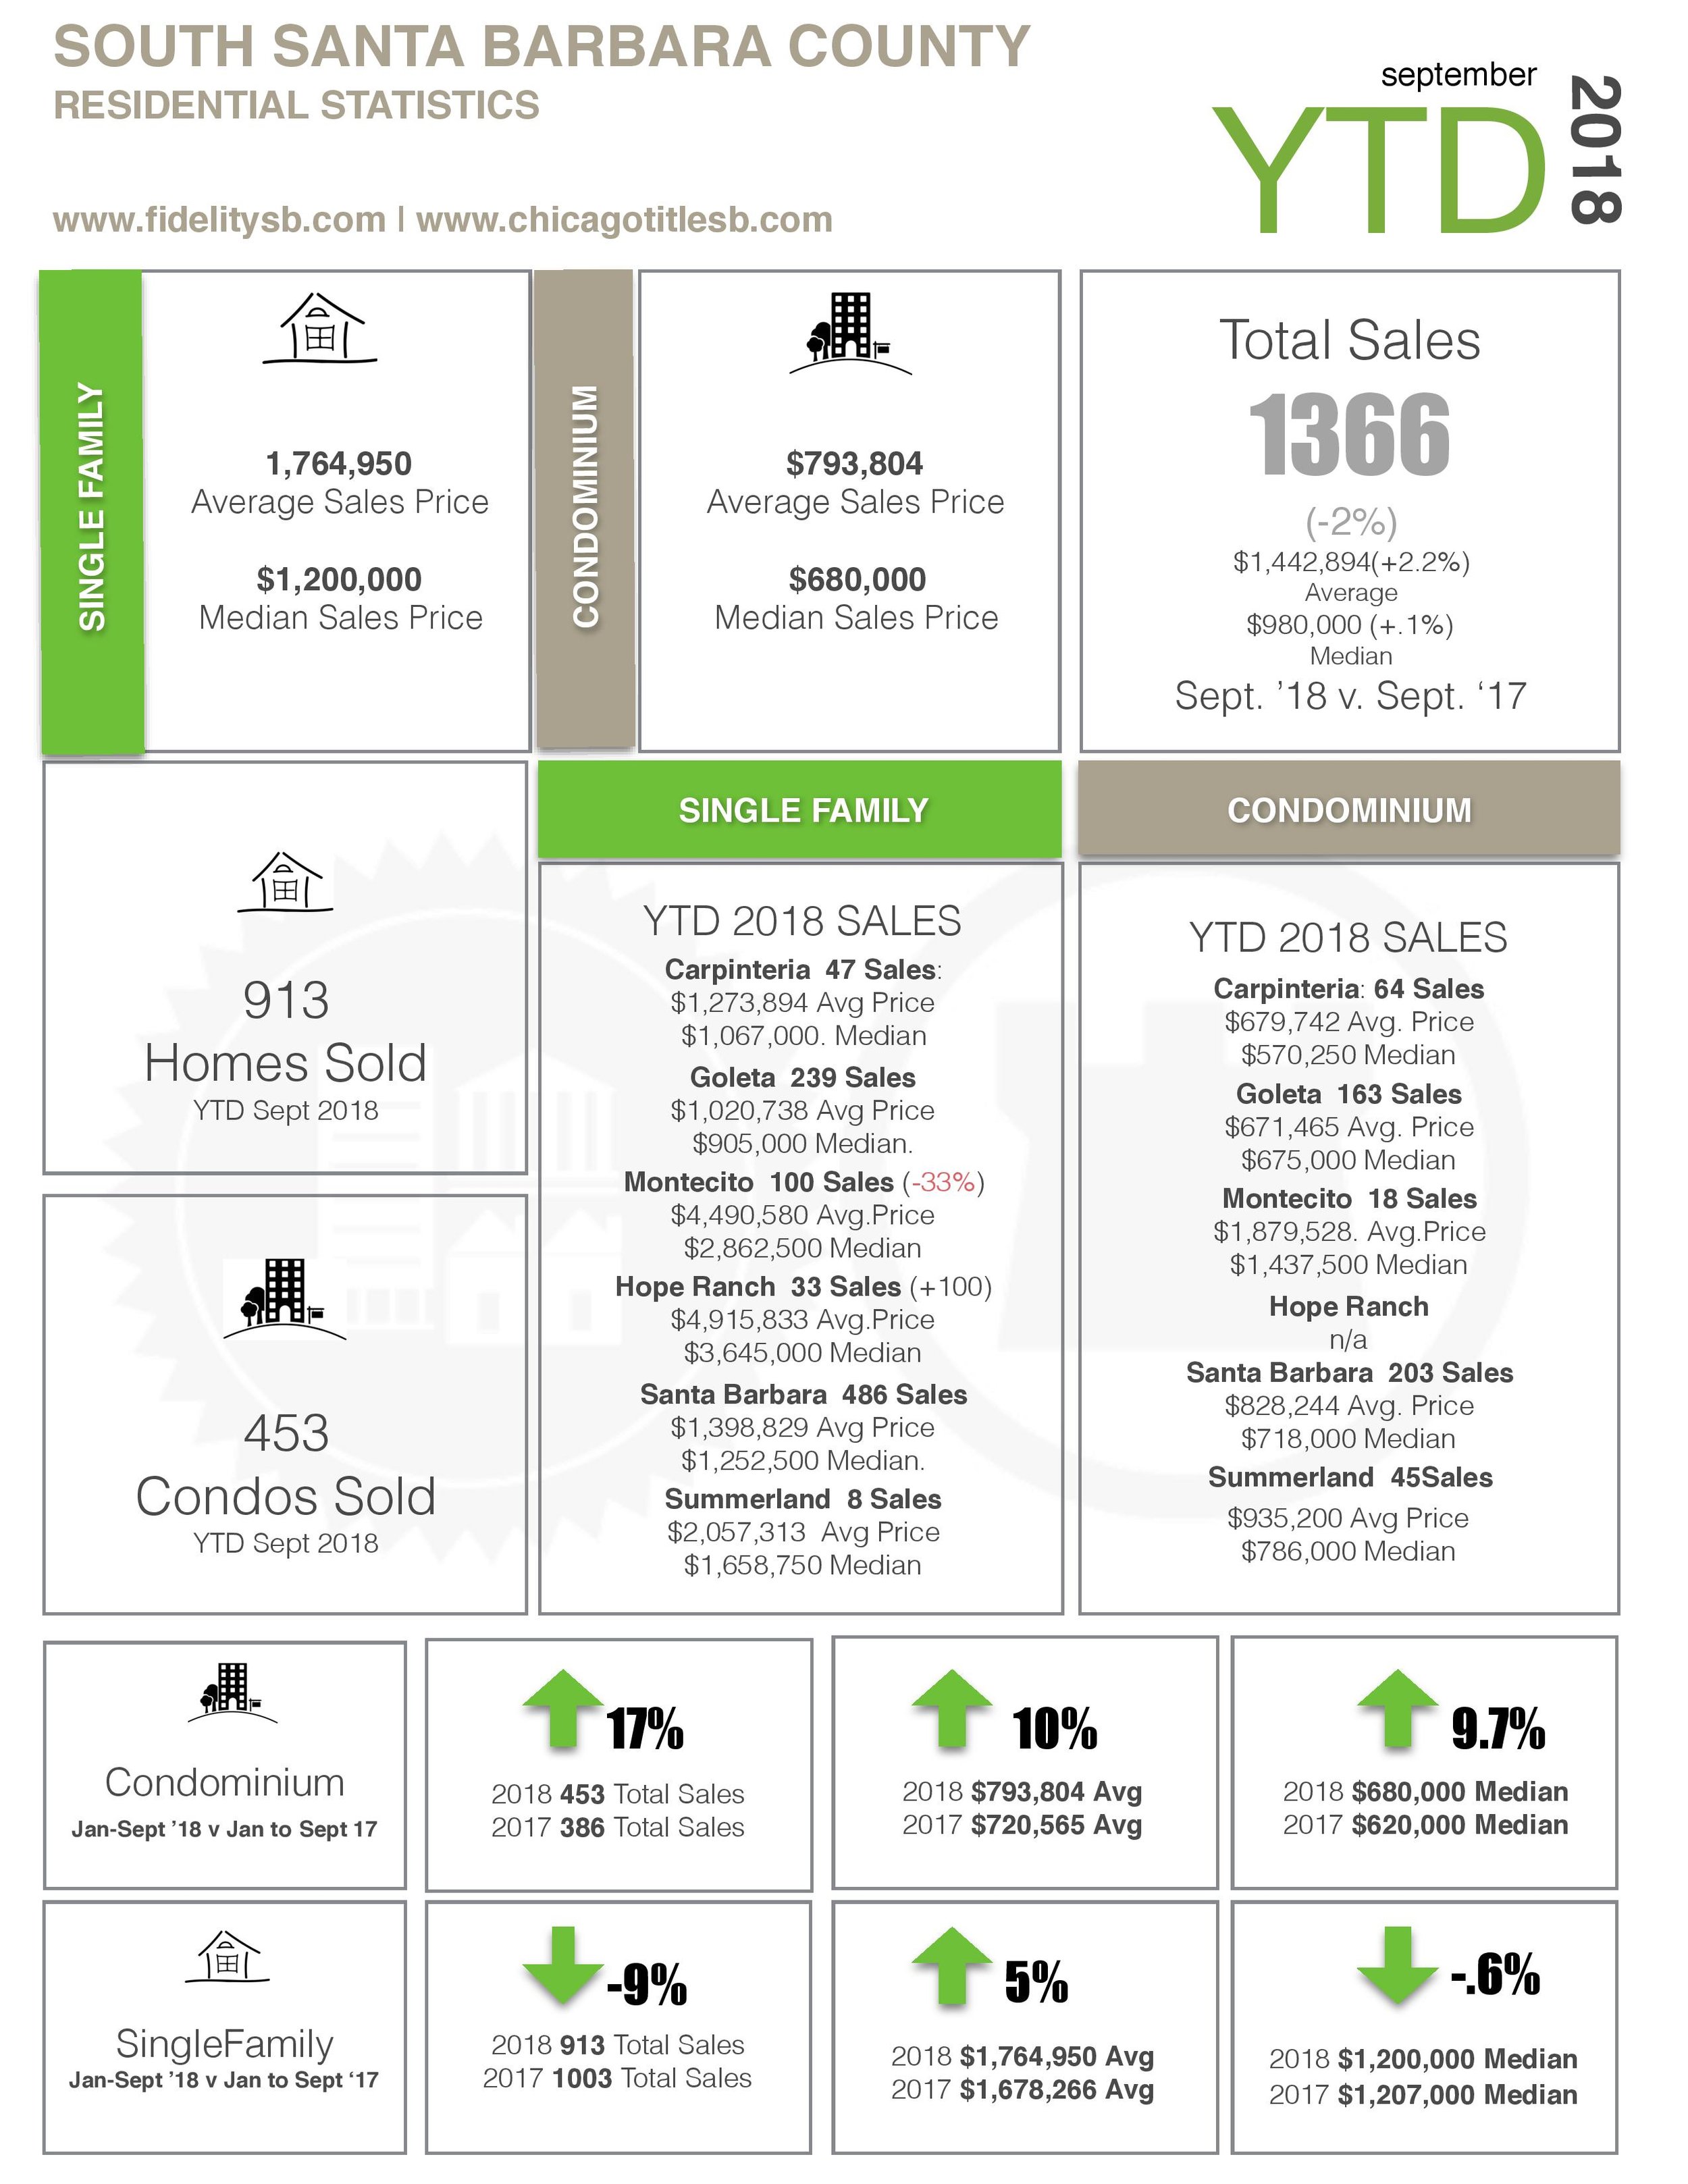
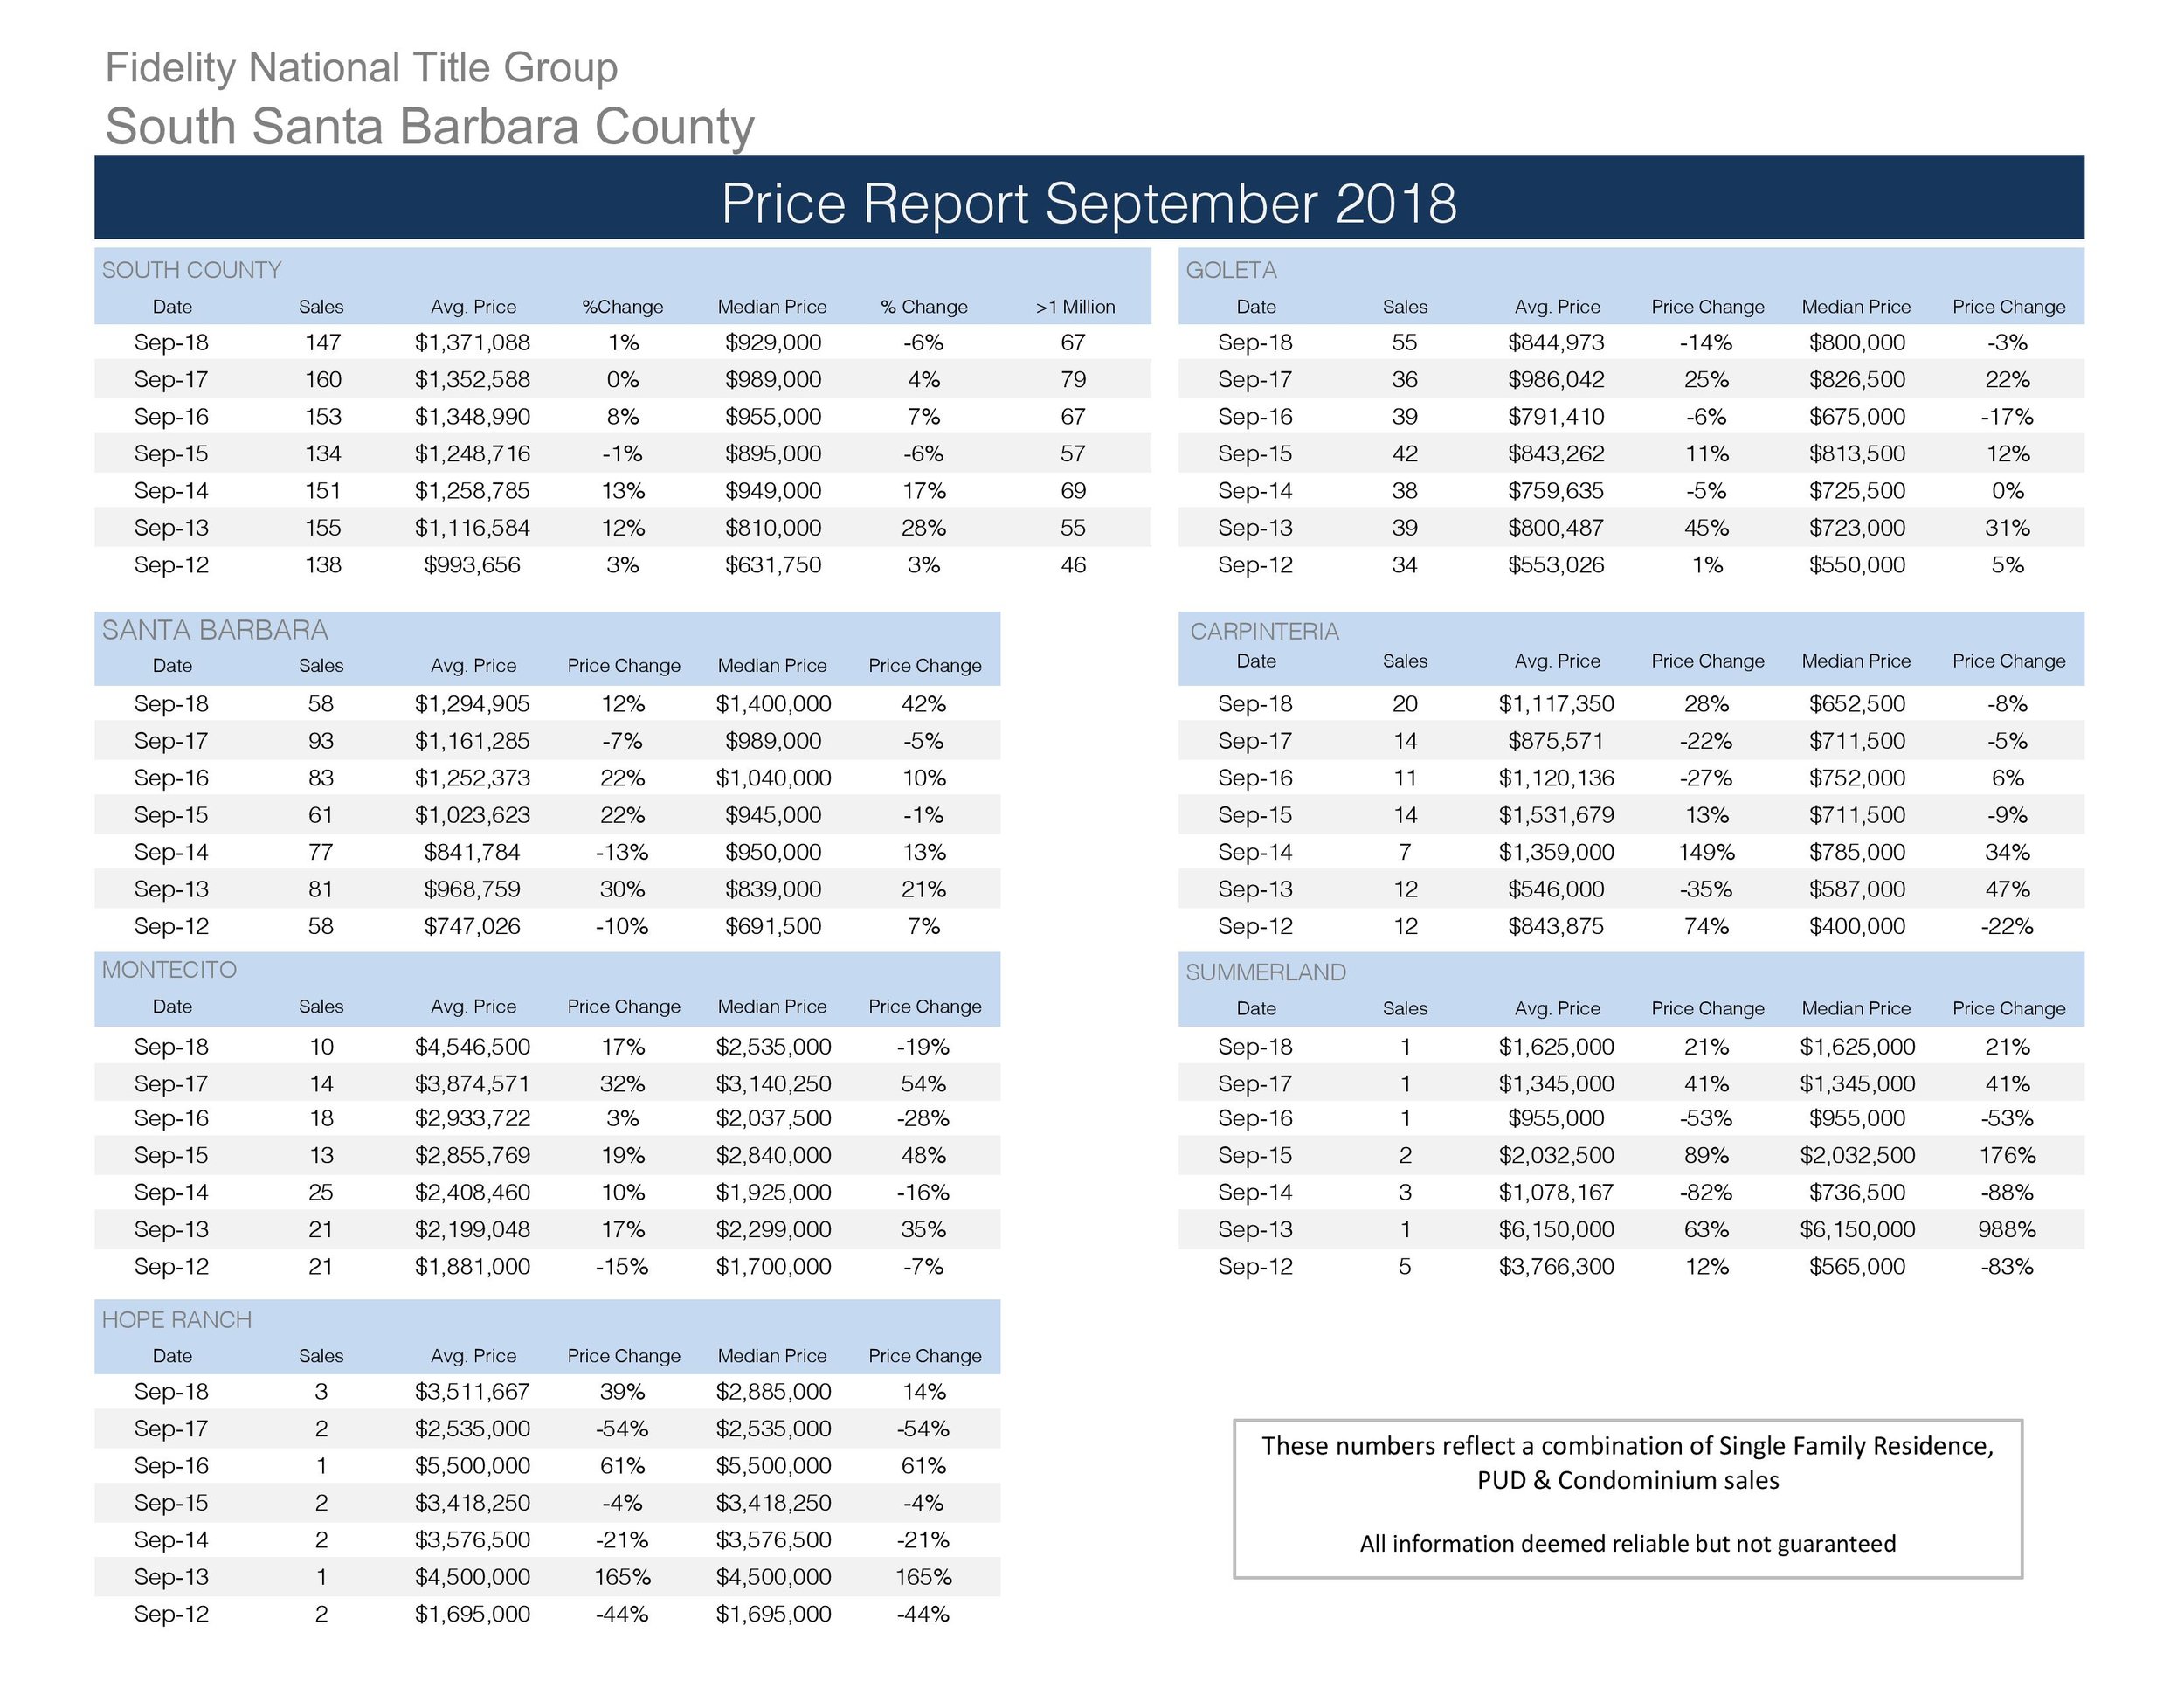
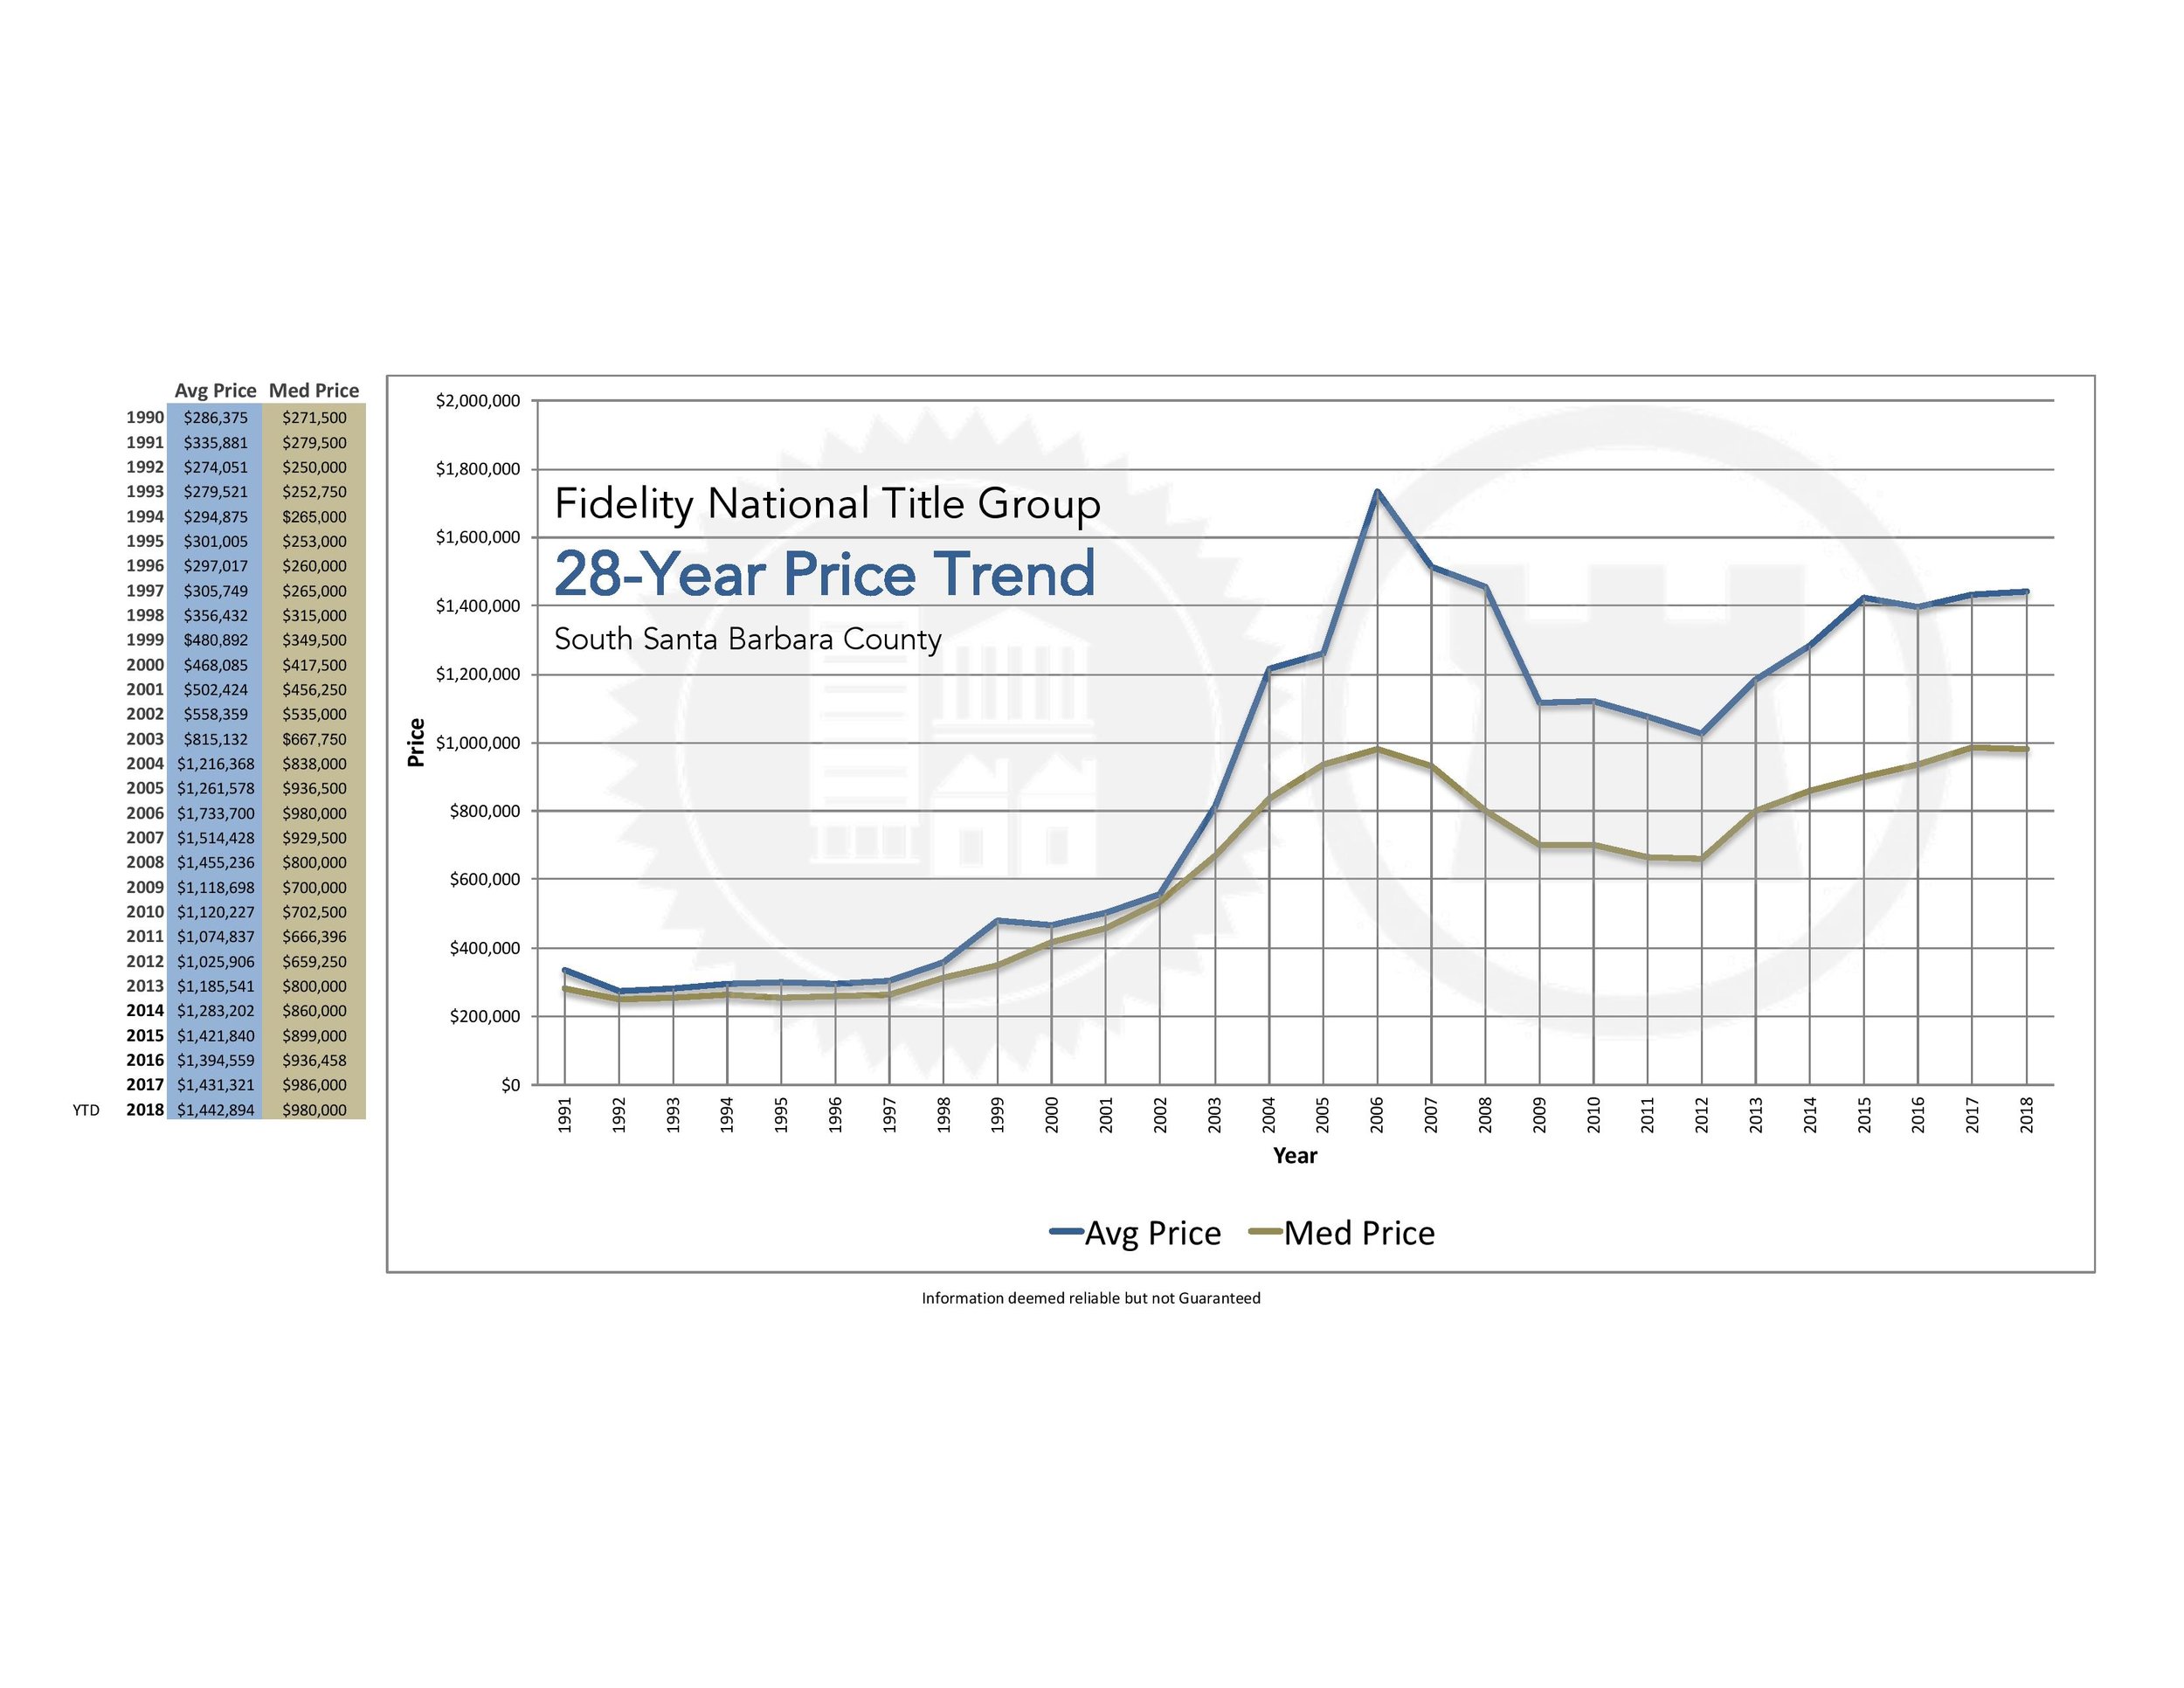
Our year-to-date median sales price (January - September) comes in at $1,200,000 (homes including condos), which is off .6% from the same period last year. Additionally, we see our total sales are off almost 10% from the same year-to-date period compared to last year. This number for 2018 was impacted by the Montecito Debris Flow, which reduced the number of sales for the first couple months of the year. These median prices are on par with the high’s we saw during the 2005 - 2007 market.
As far as month’s supply of inventory, we are seeing this skew to a more balanced market. Currently we are seeing approximately 4.4 months of inventory for homes, and approximately 3.3 months of inventory for condos. These numbers are up from last years numbers of 3.7 months of inventory for homes, and 2.2 months for condos. Generally speaking, less than 3 months of inventory is considered a seller’s market, 3-6 months a balanced market, and 6-9 months a buyer’s market.
What does the rest of the year hold for the Santa Barbara housing market? Rate increases are most likely contributing to a flattening of our median sales prices, as rates are now at the highest level since 2011, but still considered historically low by comparison. We also see more inventory as seller’s may want to realize gains as prices begin to plateau. All in all, we are in a healthier market that is responding to market forces. As we cyclically move into a slower time of year, increasing rates will lessen affordability, and our home prices and sales numbers should respond accordingly.
Check out the graphs and charts below for more information.
As always, please Contact Me with any questions or feedback!
Click on Images for pdf versions